Product plans: Standard | Premium | Enterprise | On-Prem (see: Limits by plan)
Product differences:
- Smart insights are not available in Safetica On-Prem and Safetica Platform Standard.
Introduction: What are insights
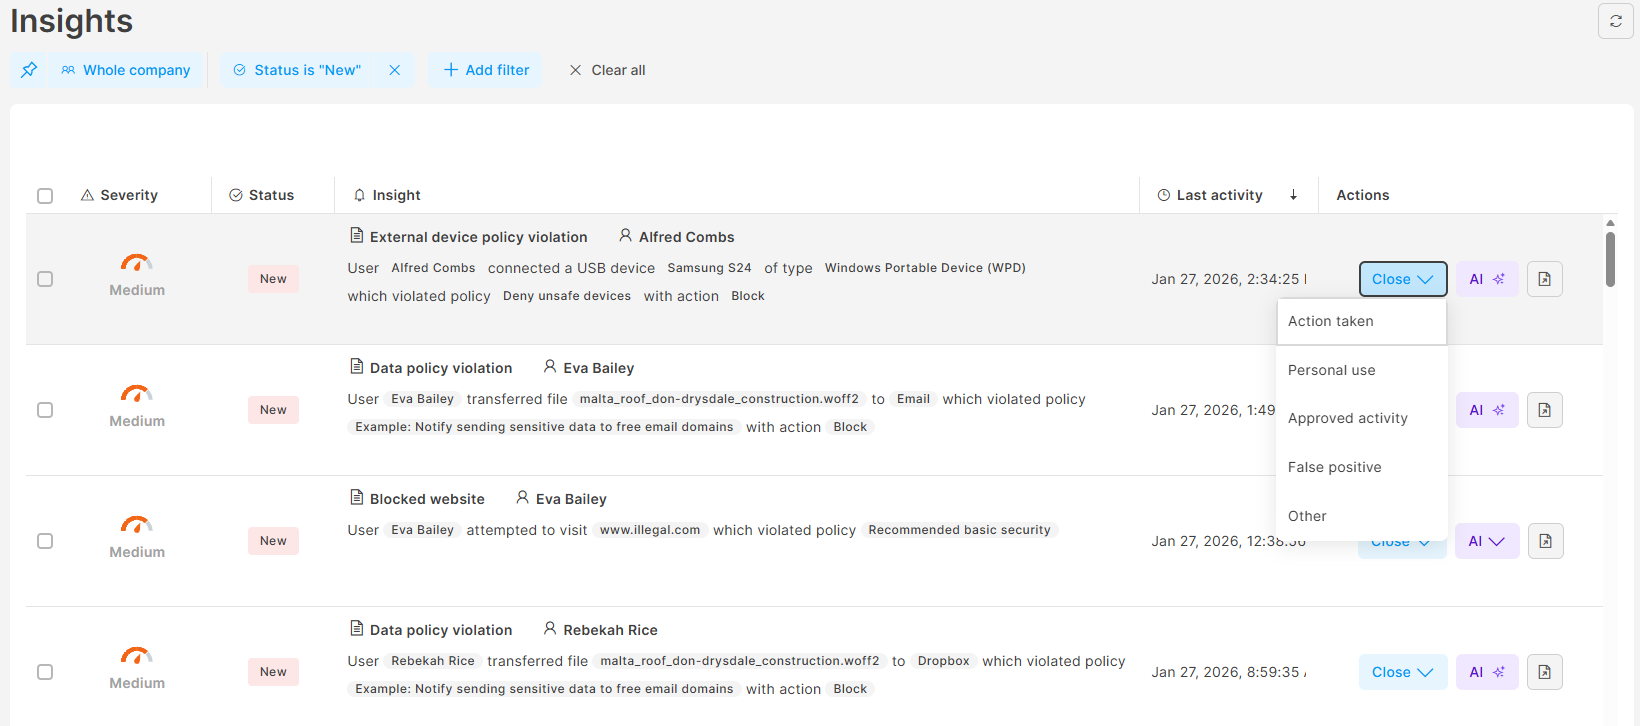
Safetica provides great insights on many fronts. The Insights section is a centralized hub in the Safetica console that highlights the most important security events that require admins’ attention. Instead of navigating through multiple sections of the console, admins can use Insights as a consolidated task list of security issues detected across Data, Apps, Websites, and External devices.
Safetica provides two types of insights:
- Insights: Triggered by policy violations (for examples by blocked applications, blocked websites, data policy violations, or external device policy violations).
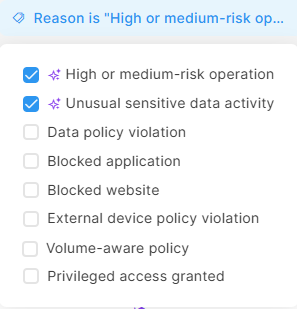
- ✨Safetica Platform only: Smart insights: Generated with the help of Safetica's AI engine. These are proactively detected insights that may not involve a specific policy violation. Smart insights include:
✍️If you want to see insights in action, watch this video.
How insights work
Safetica collects and evaluates data about operations that occur in the company to identify and consolidate important threats, incidents, and events.
- Policy-triggered insights are generated when a policy violation is detected.
- ✨Safetica Platform only: Smart insights are generated when Safetica's AI identifies risk patterns, such as medium or high-risk operations or unusual data handling behavior.
Insights are consolidated in the Insights section, where the admin's attention is drawn to their severity and short explanations so they can see at a glance what is going on.
✍️By default, only new insights are displayed, so when an admin visits Insights, they immediately see a task list of unresolved potential issues.
Processing behavior:
- In Safetica Platform, insights are triggered in real time.
- In Safetica On-Prem, insights are processed and triggered periodically every 15 minutes in batches of 100 records.
Reasons why an operation appears in Insights
Every insight has two key attributes:
- Reason: explains why the insight was triggered.
- Severity: highlights the importance of the insight to the admin.
Severity is always determined by the specific reason and, in some cases, may increase over time. The table below lists all insight reasons:
✨Safetica Platform only: Smart insights
|
Reason why the insight was triggered |
Explanation |
Severity importance of the insight |
|
High or medium-risk operation |
Triggers when an operation is evaluated as medium or high risk. Learn more.
|
Low: for medium-risk operations Medium: for high-risk operations |
|
Unusual sensitive data activity
|
Triggers when a user handles an unusually large amount of sensitive data, even if no policy is in place to protect the data. This insight warns the admin even if they haven’t fully set up policies. No remediation action is taken, but the insight highlights that a policy might need to be created to safeguard unprotected data. |
High |
Insights (policy-triggered)
|
Reason why the insight was triggered |
Explanation |
Severity importance of the insight |
|
Data policy violation |
Triggers when a data policy with Block or Block (with override) action is violated. Learn more here and here. |
Medium: for Block policy action High: for Block (with override) policy action |
|
Blocked application |
Triggers when the running of an app is blocked. Learn more. |
Medium |
|
Blocked website |
Triggers when access to a website is blocked. Learn more. |
Medium |
|
External device policy violation |
Triggers when the connection of an external device is blocked. Learn more. |
Medium |
|
Volume-aware policy
|
Triggers when a volume-aware policy becomes stricter for a specific user. Only records that contributed to making the action stricter are linked to the insight.
|
Severity increases every time policy action becomes stricter: Low: policy action changes from Not set to Log. Medium: policy action changes from Log to Notify. High: policy action changes from Notify to Block. |
|
Privileged access granted |
Triggers when an admin grants a user privileged access. Learn more.
|
High |
✍️The severity of an insight might also be influenced by policy setting. Learn how to set up insight triggering in policies here.
Record aggregation
Safetica consolidates related records – such as records associated with the same user, operation, policy, destination type, etc. – into a single insight.
- When an insight is open, all relevant records are automatically added to it, and its properties are updated accordingly.
- Once an insight is closed by an admin, no additional records will be added. If a relevant new record appears, a separate insight is created to consolidate future occurrences.
Aggregation criteria
✨Safetica Platform only: Smart insights
|
Insight |
Records aggregated based on |
|
High or medium-risk operation |
User, destination type, policy |
|
Unusual sensitive data activity |
Data classification |
Insights (policy-triggered)
|
Insight |
Records aggregated based on |
|
Data policy violation |
User, destination type, policy |
|
Blocked application Blocked website Blocked external device |
User, web domain / app display name / external device ID |
|
Volume-aware policy |
User, data classification, date |
|
Privileged access granted |
While privileged access is granted to a user, all their records are aggregated under a single insight. |
✍️An aggregated insight has the severity of its highest-severity operation.
For example, if an aggregated insight includes at least one high-severity operation, the entire insight will be evaluated as high severity.
Read next
Insights: Investigate issues via Insights
Insight detail: A bridge between the insight and other parts of Safetica console