❗If you are upgrading from old Safetica (version 10) to new Safetica (version 11), please consider the limitations of Behavior analysis described here.
In this article, you will find:
- Introduction
- Behavior analysis permissions
- Behavior analysis section
- How to investigate individual user behavior
- FAQ
Introduction
Behavior analysis helps you understand user activities across your company. It helps you identify potential security threats, audit productivity, and detect risky behaviors. Whether you're concerned about user activities on job portals, illegal websites, or unauthorized application usage, behavior analysis gives you the insights you need.
In Behavior analysis, you can:
- Audit user activities.
- Audit overall productivity trends across your company.
- Categorize user activities as Business, Non-business, or Suspicious.
- Get an overview of social media use or job portal visits.
- Identify users who engage in suspicious activities.
- Track non-business related activities during work hours.
- Create layouts and reports with user behavior patterns.
Behavior analysis in action
Want to see Behavior analysis in action? Watch the video below to learn how to analyze user activity with Safetica:
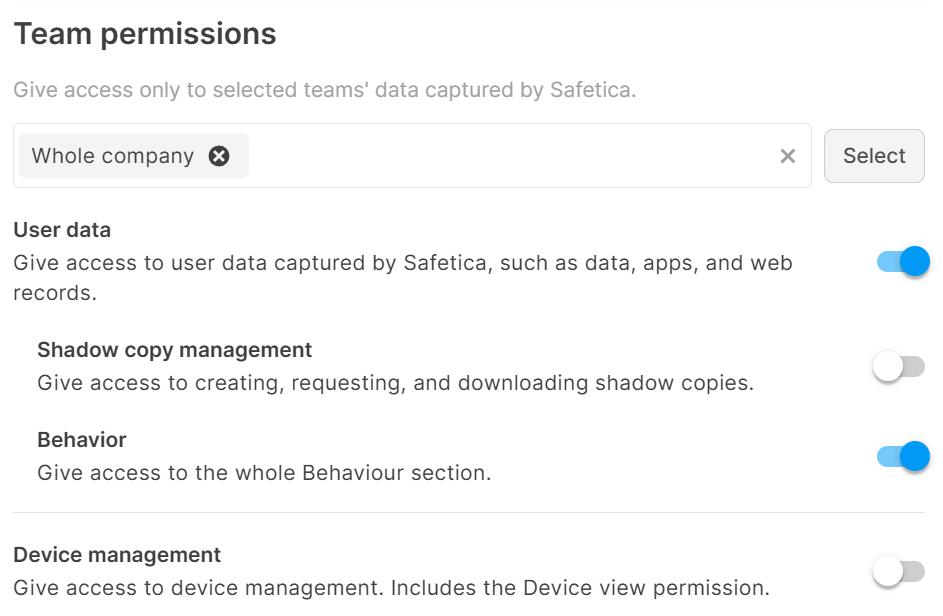
Behavior analysis permissions
To access the Behavior section, you must have the Behavior permission.
Don't have access to the Behavior section?
- Ask an admin with the Settings and configuration permission to grant the Behavior permission to you.
- They can do this in Settings > Accounts and permissions > Team permissions
✍️💻Safetica On-Prem: The admin account created during onboarding has the Behavior permission granted by default.
Behavior analysis section
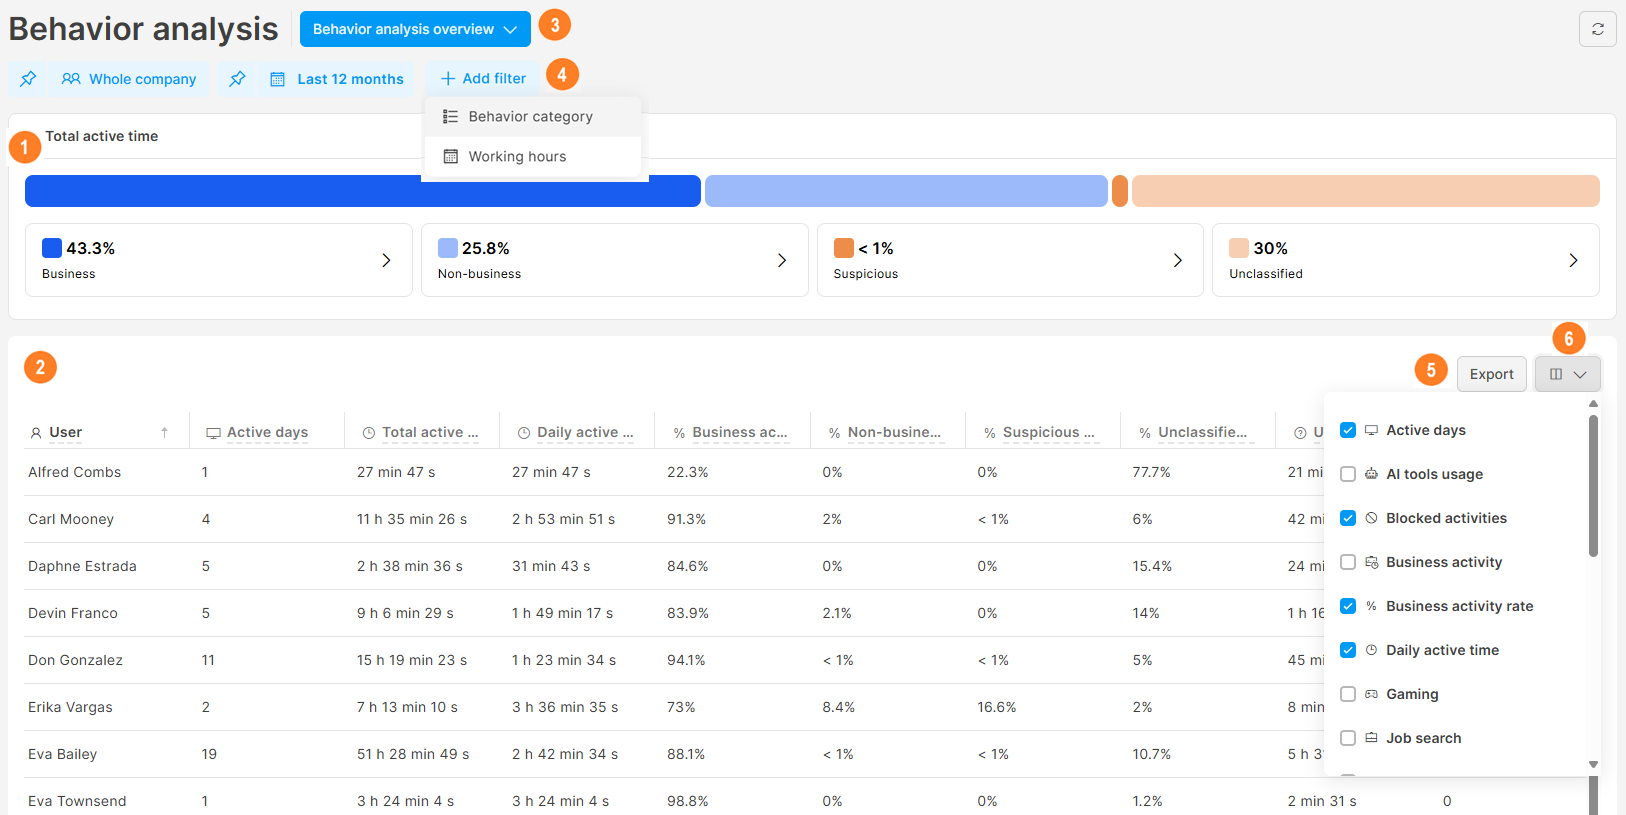
In the Behavior analysis section, you can:
- See a visual breakdown of user productivity trends: User activities are categorized into four behavior categories (learn more here), and you can see their distribution in an interactive chart. Click a segment of the chart to filter the table by that behavior category. For example, clicking Suspicious will display all users with Suspicious activity greater than 0%.
✍️Activities with 0% are not displayed in the table. Activities below 1% show as < 1%.
2. User activity table: See details about the activity of each user.
3. Layouts: Behavior analysis includes predefined layouts for common scenarios:
- Behavior analysis AI tools usage: Audit usage of AI applications and services.
- Behavior analysis job search: Identify users potentially looking for new employment.
- Behavior analysis overview: Behavior of all users in the company in the last 7 days.
- Behavior analysis suspicious activity: Focus on potentially risky activities.
✍️You can also use these layouts when creating reports. Learn more here.
4. Filters: You can filter the table by Behavior category (you can select one or multiple behavior categories), Business activity rate, Non-business activity rate, Suspicious activity rate, No behavior category activity rate, and you can also set up working hours. You can also filter specific users, teams, or devices, and the date range.
Example: You can filter users who had more than 6% of suspicious activities in the last 30 days. 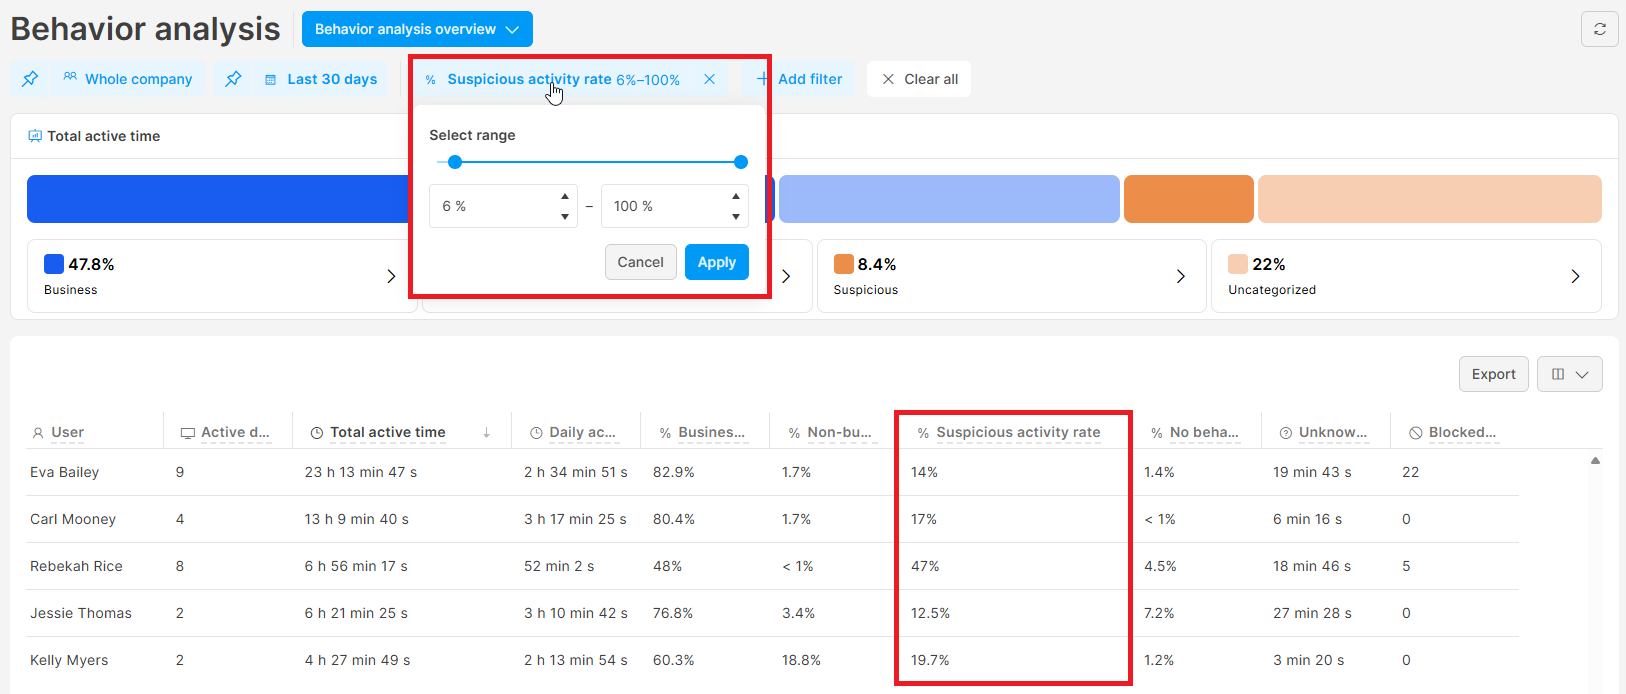
- Apply desired filters: Filter the specific users, date range, behavior categories, or working hours to display the exact data you need.
- Export the table: Click the Export button above the Behavior analysis table to download a .xlsx file.
6. Add or remove columns. You can also sort and rearrange columns.
What are behavior categories
Behavior categories simplify user activity auditing. By organizing app and website categories into clear groups (like Business, Non-business, or Suspicious), you can quickly identify productivity patterns and spot potential security risks across your company.
Safetica automatically divides app and website categories into four different behavior categories:
- Business: Work-related activities, applications, and website visits.
- Non-business: Personal or leisure activities.
- Suspicious: Activities that may pose security risks or policy violations.
- Uncategorized: Activities that are not assigned to any app or website category (and therefore, not to any behavior category).
✍️For Behavior analysis to work correctly, you should categorize as many apps and websites as possible. Learn how to do that here.
How to manage behavior categories
To manage categories, go to Management > Categories. Learn more here.
How to set up working hours
You can filter activities that happened during work hours. In the Working hours filter:
- Select your company's work days.
- Define the start and end times of your work days.

What is active time
Safetica only counts time when users are actively using an app or website:
- User is clicking, typing, or moving the mouse in the active window.
- Apps and websites open in the background don't count.
The counting of active time stops after 5 minutes of inactivity in the app or on the website. This is a default value that can be changed in Safetica Maintenance Console in Maintenance > Endpoint settings > Other settings by defining the Interval for the user's inactivity determination.
What is MD
MD is a time unit that means man-day. One man-day is equivalent to 8 hours
How to investigate individual user behavior
You can investigate activities of a specific user from their details, either in the Behavior analysis section or User section:
- Click a specific user to view their details.

- In the detail, you can see a chart with the breakdown of the user's activities into Behavior categories (Business, Non-business, Suspicious, Uncategorized).
- The chart is interactive and can be used to filter records. Just click one or more tiles to filter by Behavior category.
- As you select Behavior categories, the Website visits and App usage counts below the chart change dynamically to reflect your selection.
- You can also click:
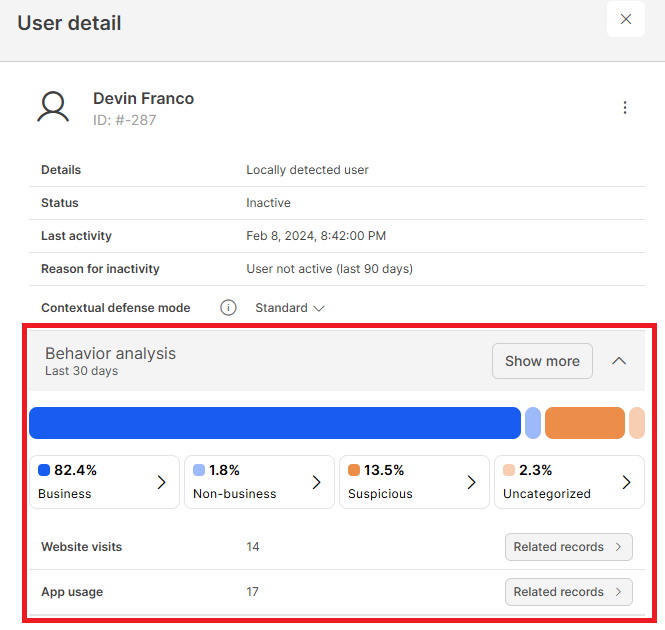
- Show more: Displays the user in the Behavior analysis section. The values are shown for the last 30 days.
- Website visits / App usage: Shows the number of websites visited / apps run by the user in the last 30 days.
- Click Related records to see exactly which websites the user visited / which apps the user run along with other details in the Website visits or App usage sections.
FAQ
Q: The Behavior analysis section shows that I do not have access to it. What should I do?
A: Request the Behavior permission from an admin who has the Settings and configuration permission.
Q: Can I change which activities belong to individual behavior categories? Can I change which activities are categorized as Business, Non-business, or Suspicious?
A: Yes, you can. You can drag-and-drop existing app and website categories between Business, Non-business, and Suspicious behavior categories.
If you need to change the app/website category of an individual app or website, you can learn more here.
Q: How do I categorize "Uncategorized" activities?
A: To reduce uncategorized activities, categorize as many applications and websites as possible. Based on app/web categories, they are automatically assigned to the appropriate behavior category. Learn more about categorizing apps and websites here.