![Logo landing page 232x64 with border.png]](https://support.safetica.com/hs-fs/hubfs/Marketing/Safetica_logo_/Logo%20landing%20page%20232x64%20with%20border.png?width=145&height=40&name=Logo%20landing%20page%20232x64%20with%20border.png)
Product plans: Premium | Enterprise | On-Prem (see: Limits by plan)
Introduction: What is the webhook integration?
✍️This feature was previously called SIEM integration. The capability is unchanged; the name is broader because the integration was never SIEM-specific.
Safetica's webhook integration sends security events to any system that accepts an incoming HTTP webhook. Events are formatted using the open OCSF standard, so you can forward Safetica insights and admin trail records to:
- SIEMs such as Splunk, IBM QRadar or FortiSIEM
- ticketing tools such as Jira
- chat tools such as Microsoft Teams or to
- automation platforms such as Zapier, Make, Microsoft Power Automate and n8n - which in turn connect Safetica to thousands of other applications.
The webhook integration is a general-purpose outbound feed from Safetica. Whenever Safetica records an insight or an admin trail record, it sends that event as a JSON payload to a URL you choose.
Because it is a standard webhook, the integration is not limited to SIEM platforms. Any system that can receive an HTTP POST request can receive Safetica events, and tools that cannot receive webhooks directly can still be connected through an automation platform. You can correlate Safetica events with security data from other sources, alert your team in a chat channel, open tickets automatically, or archive audit evidence.
❗The webhook integration sends events over HTTP webhooks only. Syslog is not supported.
This article explains what Safetica sends, how to set the integration up, and how to connect specific tools.
Prerequisites
- A tool that can receive incoming webhooks, or an automation platform that passes events on to it.
- Network connectivity between Safetica and the receiving system.
- ✨ Safetica Platform only: If the receiving system restricts inbound traffic by IP (your tool only accepts data from approved IP addresses), allow Safetica's outbound IP address that matches the data center where your Safetica is hosted:
| Region | Outbound IP |
|---|---|
| EU | 52.232.44.144 |
| US | 4.155.7.85 |
| BR | 20.226.40.46 |
✍️Only one webhook integration can be configured at a time. If you need to send events to several destinations at once, point the webhook at an automation platform (Zapier, Make, Power Automate, or n8n) and distribute the events from there.
Permissions
Only Safetica admins with the Settings and configuration permission can activate or edit the webhook integration. The permission can be enabled or disabled in:
- ✨ Safetica Platform: Settings > Safetica settings > Accounts and permissions
- 💻 Safetica On-Prem: Settings > Accounts and permissions
Which tools you can connect
You can connect any tool that can receive an incoming webhook. Common categories:
| Category | Examples |
|---|---|
| SIEM | QRadar, Rapid7, Splunk, FortiSIEM |
| Ticketing | Jira |
| Chat and alerting | Microsoft Teams |
| Automation platforms | Zapier, Make, Microsoft Power Automate, n8n |
✍️ We have prepared guides for Jira, Zapier, Make, Power Automate, Microsoft Teams, and n8n. You can find them here.
✍️ Automation platforms connect to thousands of applications, so they can pass Safetica events on to almost any tool, including ones that cannot receive a webhook themselves.
Connecting a tool that is not listed
The list above is a set of examples, not a limit. Safetica sends a standard HTTP webhook, so it can connect to almost anything:
- Check your tool's own documentation for "incoming webhook", "inbound webhook", or "webhook trigger". If your tool can receive a webhook, Safetica can send to it.
- If it can't, use an automation platform such as Zapier, Make, Power Automate, or n8n. These connect to thousands of applications: Safetica sends the event to the platform, and the platform passes it on to your tool. These are third-party services and may require a paid plan.
What Safetica sends
Safetica sends data from two sources. You can enable either or both:
- Insights: The security findings Safetica detects on devices: policy violations, blocked activity, and risky behavior. Use them to alert your team, open tickets, or feed a SIEM.
- Admin trail records: A record of configuration changes (who changed what and when) in the Safetica console (for example, a policy was edited or a setting was disabled). Use them as audit and compliance evidence.
Insight types
There are nine insight types:
| Insight | Typical meaning |
|---|---|
| High or medium-risk (created) | A new high or medium-risk operation was detected |
| High or medium-risk (updated) | An existing high or medium-risk finding changed |
| Data policy violation | Data was moved in violation of a data policy |
| Blocked application | A blocked application was launched |
| Blocked website | A blocked website was visited |
| External device policy violation | A USB or external device violated policy |
| Volume-aware policy | A policy with a dynamic, volume-based action was triggered |
| Privileged access granted | Privileged access was granted |
| Unusual sensitive data activity | Abnormal handling of sensitive files |
✍️ The title field inside the payload does not always match the insight name above. A volume-aware policy event, for example, arrives with the title Policy with dynamic action.
Event format
Events use the Open Cybersecurity Schema Framework (OCSF), an open standard maintained under the Linux Foundation. You can browse the full schema in the OCSF schema browser. Safetica sends three OCSF classes:
| OCSF class | Contains |
|---|---|
2006 Data Security Finding |
High or medium-risk and Data policy violation insights |
2005 Incident Finding |
All other insights |
6003 API Activity |
Admin trail records |
To tell the two data sources apart, use category_uid: - value 2 means an insight, 6 means an admin trail record.
Severity levels
severity_id |
Severity |
|---|---|
| 1 | Informational |
| 2 | Low |
| 3 | Medium |
| 4 | High |
| 5 | Critical |
Safetica sends all insights, from Informational to Critical. If you only want to act on higher-severity events, filter them in the receiving tool.
How to set up the webhook integration
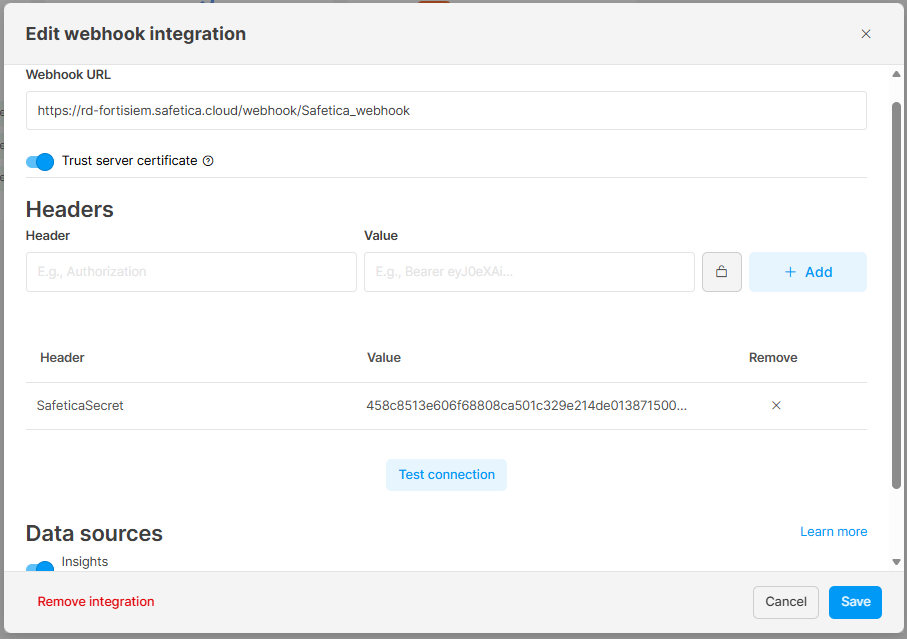
- In Safetica console, go to:
- ✨ Safetica Platform: Integrations
- 💻 Safetica On-Prem: Cloud services
- Click Activate webhook integration.
- Webhook URL: Enter the webhook URL provided by the receiving tool.
- Trust server certificate: Switch this on only if the receiving system uses a self-signed or internal certificate. The certificate is then accepted without validation, so only use it for certificates you control.
- Headers (optional): For receiving tools that require unique authorization headers, enter the header it specifies as a Header: Value pair and click Add.
- Private parameters: Click the lock icon to make the value private (hidden under ****). Private values are never shown in the console again.
- Click Test connection to verify that Safetica can reach the receiving system.
- Data sources: Select what to send: Insights, Admin trail records, or both.
- Click Save.
Safetica starts sending insights or Admin trail records to the receiving system as OCSF-formatted JSONs. You can then filter, correlate, and process them there alongside your other data.
❗Do not add a Content-Type header.
Safetica already sends Content-Type: application/json with every request, and adding it again in the Headers section causes some services (Jira among them) to reject the connection.
Guides and AI assistants often suggest adding Content-Type: application/json, because that is standard advice for webhooks in general. For Safetica, it is unnecessary and can break the connection.
Leave the Headers section empty unless the receiving tool needs a header for authentication.
About Test connection
Test connection confirms that Safetica can reach the URL and that the receiving system accepts the request. If the integration is set up correctly, the test succeeds. If it fails, something genuinely needs fixing - work through the Troubleshooting section at the end of this article.
Two things are useful to know:
- The test sends a small test request, not a full event. If you have configured the receiving tool to validate incoming data against a strict schema, that validation may reject the test request. Remove the schema (see the Power Automate guide here for an example).
- A few services return success for any request they receive, even when an access token is wrong or the receiving rule is switched off. Jira behaves this way. For these, also confirm the result in the receiving tool's own activity log.
Once the test passes, trigger a real event to confirm the whole chain works end to end.
How to edit or remove the integration
If you want to make changes to the integration:
- In Safetica console, go to:
- ✨ Safetica Platform: Integrations
- 💻 Safetica On-Prem: Cloud services
- Click Edit webhook integration.
- Make the necessary changes.
- Click Test connection and then Save.
If you want to remove the integration, click Edit webhook integration and then Remove integration.
Working with the event data
How to see what Safetica sent
Before you map event fields into a ticket, message, or table, it helps to look at a real event. Every tool has a way to show you the raw payload:
| Tool | How to see the payload |
|---|---|
| Jira | Add a Log action step with the message |
| Zapier | Click Test trigger on the Catch Hook step |
| Make | Click Redetermine data structure on the webhook module, then send an event while it listens |
| Power Automate | Add a Compose action containing triggerBody(), then open the flow's run history |
| n8n | Click the Executions tab and select a run |
In every case, trigger a real insight rather than relying on the connection test. The test sends only a small request and will not show you the full set of fields.
Telling insights apart from admin trail records
Use category_uid: 2 is an insight, 6 is an admin trail record.
Finding the details of an insight
Insights arrive in one of two OCSF classes, and the finding is stored in a different place in each:
| Class | Finding location | Shape |
|---|---|---|
2005 Incident Finding |
finding_info_list |
A list. Take the first item. |
2006 Data Security Finding |
finding_info |
A single object |
This matters: High or medium-risk and data policy violation insights use class 2006, and these are often your highest-severity events. An integration written only for finding_info_list produces empty fields for exactly those events, without showing an error.
To handle both, read finding_info_ first and fall back to the first item of finding_info_list.
| Platform | Expression |
|---|---|
| n8n | <br><br> |
| Power Automate | coalesce(triggerBody()?['event']?['finding_info']?['title'], first(triggerBody()?['event']?['finding_info_list'])?['title']) |
| Make | |
Use the same approach for src_url (a direct link back to the event in Safetica) and uid (the event identifier).
Useful fields
| Field | Contains |
|---|---|
severity / severity_id |
Severity of the event |
actor.user.name, actor.user.email_addr |
The user involved |
time_dt |
When the event occurred |
enrichments[].value |
The object involved: file name, website URL, application name, or device name |
unmapped.PolicyName |
The policy that triggered the event |
unmapped.DataCategories |
Categories of data involved, such as Personal data |
unmapped.DestinationPaths |
Where the data was going |
api.operation, http_request.url.path |
Admin trail only: what was changed |
enrichments[].value and unmapped.PolicyName are usually the two most useful fields for a readable alert: together they answer what happened and to which file.
Example payload
A data policy violation insight (class 2006), abbreviated:
{
  "event": {
    "class_uid": 2006,
    "class_name": "Data Security Finding",
    "category_uid": 2,
    "activity_name": "Create",
    "severity_id": 5,
    "severity": "Critical",
    "status": "New",
    "time_dt": "2026-08-10T09:23:13+02:00",
    "metadata": {
      "product": {
        "name": "Safetica",
        "feature": { "name": "Endpoint DLP", "version": "11.135.0.0" }
      }
    },
    "enrichments": [
      { "name": "File name", "value": "core-engine.tar.gz" }
    ],
    "unmapped": {
      "DataCategories": ["Source code", "Personal data"],
      "DestinationPaths": ["https://wetransfer.com/upload"],
      "PolicyName": "Block source code to web"
    },
    "actor": {
      "user": { "name": "Jan Novák", "email_addr": "jan.novak@acme-corp.com" }
    },
    "finding_info": {
      "title": "Data policy violation",
      "uid": "Safetica/5002",
      "src_url": "https://console.safetica.com/acme-corp/platform/data?filters.incidentId.value=5002"
    }
  }
For a class 2005 insight, the structure is the same, except that the finding appears as the first entry of a finding_info_list array instead of in finding_info.
Tips for building your mapping
- Some fields can be empty. Build your mapping so a missing field leaves a blank rather than causing an error.
activity_iddistinguishes new events (1) from updates (2or3). An updated event keeps the sameuid, so you can match it to the original.- In admin trail records,
api.request.datais a text string containing JSON. To read the values inside it, parse it separately.
Setup guides for specific tools
The following guides have been tested by Safetica. In each case, the Safetica side is the same: paste the webhook URL, and add a header only if the receiving tool needs one to authenticate. Never add a Content-Type header. Most of the work happens in the receiving tool. You can find the guides here.
Troubleshooting
| Problem | Solution |
|---|---|
| The connection test fails | Remove any Content-Type header. Check the URL was pasted in full: webhook URLs are long and easily truncated. |
| SSL or certificate error | Enable Trust server certificate. Only do this for self-signed or internal certificates that you control. |
| The connection test passes but nothing arrives | A few services (Jira among them) return success even when an access token is wrong or the receiving rule is switched off. Check the receiving tool's own activity log. |
| Events arrive but fields are empty | The field path may not match that event type. See Working with the event data. |
| The receiving tool records unexpected empty entries | These are connection tests, which contain no event data. Add a condition in the receiving tool so only real events are processed. |
| Nothing arrives and the receiver is behind a firewall | Allow Safetica's outbound IP for your region. |
| You need to send events to two systems |
Only one integration can be active. Send events to an automation platform and distribute them from there. |
FAQ
Q: I am getting an SSL connection error when connecting Safetica to my webhook tool. What can I do?
A: Please try enabling the Trust server certificate toggle. Afterwards, the server’s SSL certificate will be accepted without validation and should stop causing the error. Only use the toggle for self-signed or internal certificates.
Q: Do you support Syslog for integration with SIEM?
A: Yes, partially:
- Alerts: Safetica On-Prem alerts configured in Safetica Maintenance Console can be sent to a SIEM or another server that supports Syslog.
- Insights and admin trail records: These cannot be sent via Syslog. This applies to both Safetica On-Prem and Safetica Platform.
Q: Does Safetica support webhooks?
A: Yes. Safetica can send security insights and admin trail records to any system that accepts an incoming HTTP webhook.
Q: Can Safetica send alerts to Microsoft Teams?
A: Yes. Because Teams expects its own message format, connect it through Power Automate, Make, Zapier, or n8n, which convert the event into a chat message. See the Microsoft Teams guide.
Q: Can Safetica send alerts to a chat tool other than Teams?
A: Yes, if the tool accepts an incoming webhook, or if it is supported by an automation platform such as Zapier, Make, Power Automate, or n8n.
Q: Can Safetica create a Jira ticket automatically?
A: Yes. Use a Jira Automation rule with an incoming webhook trigger, then add a Create work item action. See the Jira guide.
Q: What format does Safetica use for webhook events?
A: Events are sent as JSON in the Open Cybersecurity Schema Framework (OCSF) format, an open standard maintained under the Linux Foundation.
Q: Can I connect a tool that doesn't support webhooks?
A: Yes, through an automation platform such as Zapier, Make, Power Automate, or n8n. These connect to thousands of applications and pass the event on to your tool.
Q: Can Safetica export audit logs?
A: Yes. Admin trail records show who changed what in the Safetica console and can be sent to any webhook destination as compliance evidence.
Q: Can I send events to more than one system at once?
A: Only one webhook integration can be active at a time. To reach several destinations, send events to an automation platform and distribute them from there.
Q: Which insights are sent?
A: All of them, from Informational to Critical severity. Filter by severity in the receiving tool if you only want higher-severity events.