Applies to: Safetica On-Prem
In this article, you will learn more about:
Requirements
1. Safetica Console
2. Review exceptions for Safetica in your other security solutions: How to set up exceptions for Safetica Client in your antivirus
Exclude trusted websites
If Safetica disrupts access to a trusted website that doesn’t need protection, admins can whitelist it. Websites or IP addresses can be excluded from SSL/TLS inspection so that Safetica will not affect their secured communication. This is particularly useful for websites that require specific certificates or use HTTP/3. This ensures uninterrupted access for users while maintaining overall security.
✍️Use case: Troubleshooting issues when a well-established website cannot be accessed by users with installed Safetica Client.
Examples of trusted websites: Government portals, banking websites.
How to exclude a trusted website
- In Safetica console, go to Settings > Protection exclusions.
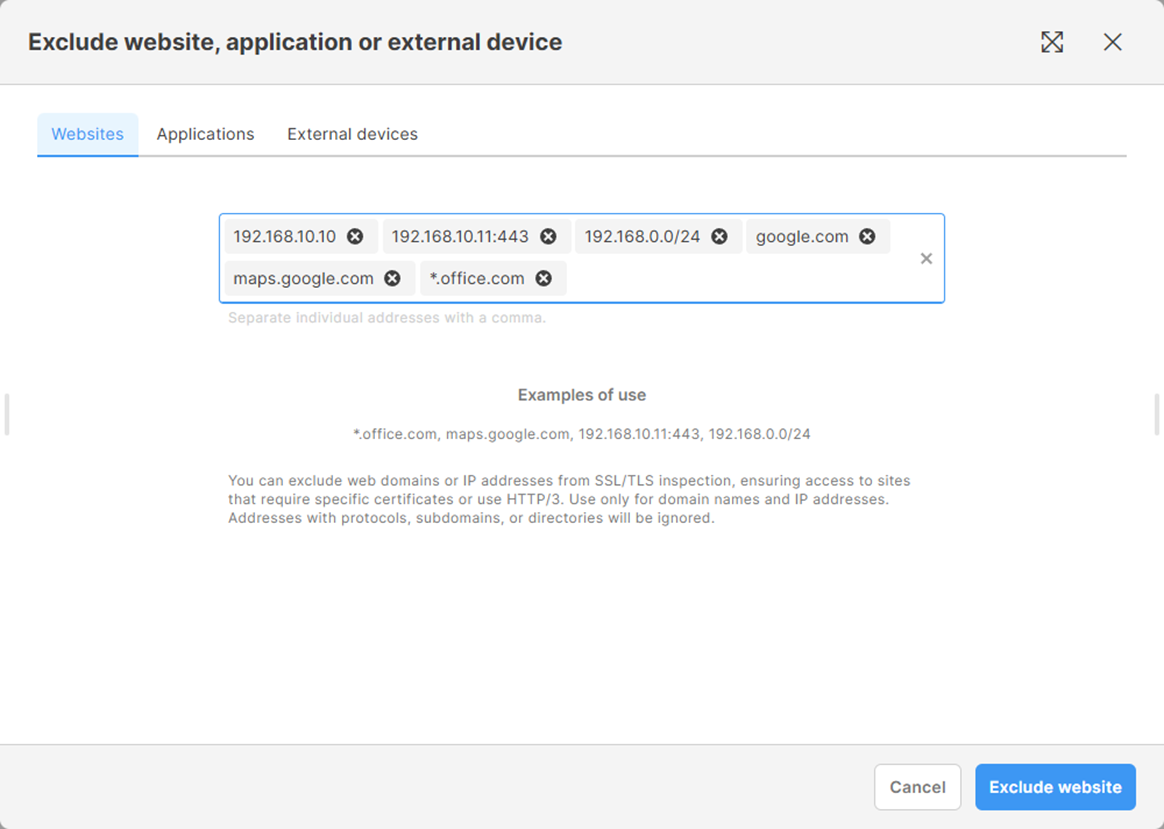
- Click Exclude and go to the Websites tab.
- Enter the domain name or IP address of the websites you want to exclude.
- Click Exclude website.
- The websites will be added to the Protection exclusions list.
✍️Tips:
- Add multiple websites at once, separated by a comma.
- You can exclude domain names and IP addresses:
- IP addresses, including ports (e.g., 192.168.10.10 or 192.168.10.11:443).
- CIDR ranges or subnet masks (e.g., 192.168.0.0/24).
- Domains and subdomains (e.g., google.com or maps.google.com)
- Entire domains with all subdomains using wildcards (e.g., *.office.com).
- URLs with protocols or directories are ignored (e.g., https://www.company.com or company.com/our-profile).
Collecting logs:
- In Safetica Console, go to Devices > Detaill > right-click > choose Run Troubleshooting and wait for activation.

- Run STSupportTool.exe. You can find it either:
- on the affected device in C:\Program Files\Safetica\Tools, or
- on the Safetica Server in C:\Program Files\Safetica Management Service\Tools
- Click Create application issues report.
- Check the Network monitoring logs checkbox and click Run.
- Reproduce the issue. Once done, click Reproduced and wait for the monitoring to finish.
- Click Report, describe the issue, and proceed by clicking Next.
- Finish the wizard and upload the obtained .sfx output to upload.safetica.com.