In this article, you will learn:
Introduction: What is the Admin trail, and why is it important
The Admin trail provides a detailed history of activities performed by administrators in Safetica console. Industry regulations often require companies to keep records of system and admin activities, making the Admin trail essential for audits and security oversight.
The Admin trail helps detect suspicious administrator behavior and identify potential security threats. It enhances accountability by providing a clear record of who made specific changes, when, and where in the console. For example, if a policy is changed incorrectly or data is deleted, the Admin trail can pinpoint the responsible admin and the exact time of the action.
Admin trail in action
Want to see the Admin trail in action? Watch the video below:
What activities are audited
The Admin trail records all changes made in Safetica console, including policy updates, permission changes, deletions, etc.
What admin accounts are audited
All admin accounts are audited.
✨Safetica Platform: Activities from Safetica HUB console admin accounts (including partners) are also audited, even though they are not visible in the Safetica console.
💻Safetica On-Prem: Activities performed in Safetica Maintenance Console are not included in the Admin trail.
Admin trail permissions
Permissions for the Admin trail are as follows:
- View the Admin trail: Only Safetica admins with the Settings and Configuration and the Admin trail permissions can view the records about other admins' actions in Safetica console. The permissions can be enabled or disabled in Settings > Accounts and permissions.

How to view admin activities performed in Safetica console
To access and review admin activities:
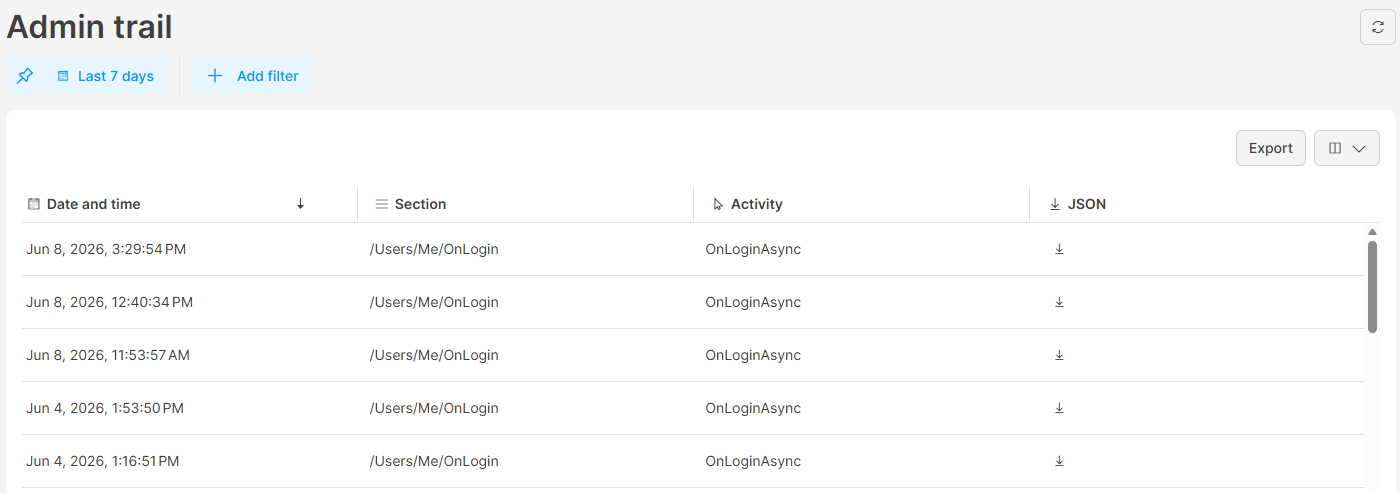
- Open Safetica console and go to Settings > Admin trail.
- You will see a list of activities performed by all admins.
Filtering options
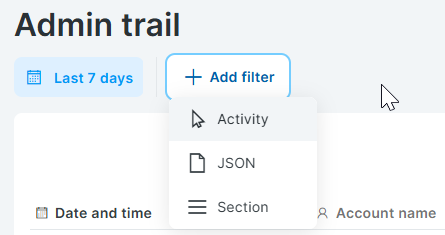
You can refine the Admin trail records using the following filters:
- Activity: Filter by specific activities. For example, to display only policy-related activities, enter “policy”.
- JSON: See more details by filtering for a JSON key. For example, to find all records related to a data classification called "Finance: PCI DSS", enter "Finance: PCI DSS" into the JSON filter.
- Section: Filter activities that were performed in a specific section of Safetica console. For example, to view changes that happened in the Users section, enter “Users”.
You can also:
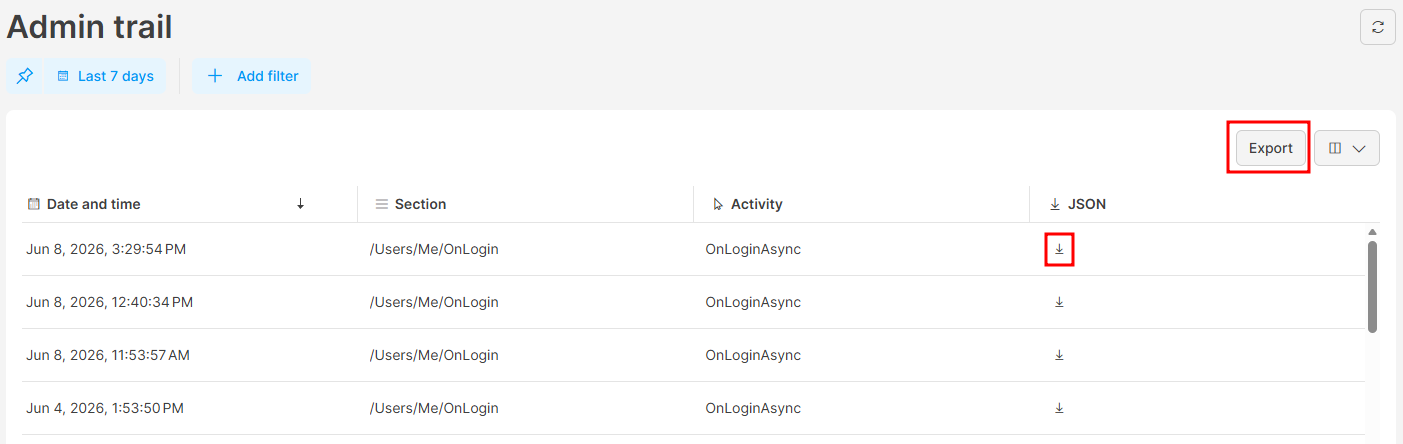
- View details: Click a specific record to view its details in the JSON format.
- Download proof of activity: Click the download icon
 to download the JSON file and keep proof of a specific admin activity or process it further.
 - Export: Click Export to export the Admin trail table to an XLSX file.

FAQ
Q: Can admin trail logs be synced from Safetica to API or SIEM integration?
A: No, syncing of admin trail logs via API or SIEM is not supported. Admin trail logs can only be downloaded manually as individual JSON files by navigating to Safetica > Settings > Admin trail and clicking the download icon![]() .
.