Applies to: Safetica On-Prem
In this article, you will learn more about:
- Endpoint and server connectivity issues
- Definition update, server update connectivity issues
- Advanced network logs
- Testing connectivity on MacOS machine
Endpoint and server connectivity issues:
Check the connectivity between the endpoint and Safetica Server using the PowerShell:
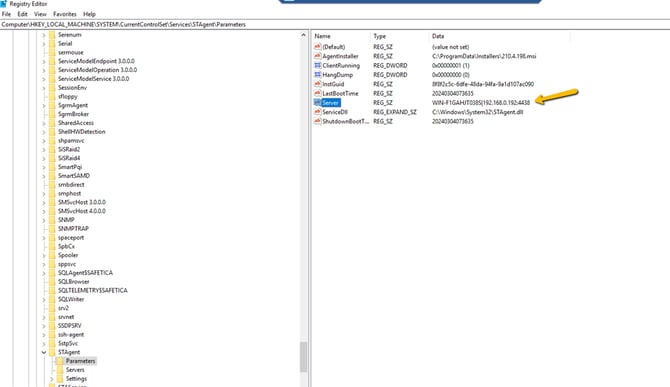
- Open the key below to see what your connecting string to the Safetica Server is HKEY_LOCAL_MACHINE\SYSTEM\CurrentControlSet\Services\STAgent\Parameters
- In the PowerShell, test the connectivity to the listed servers, for example:
Test-NetConnection -ComputerName WIN-F1GAHJT038S -Port 4438
- Output example:
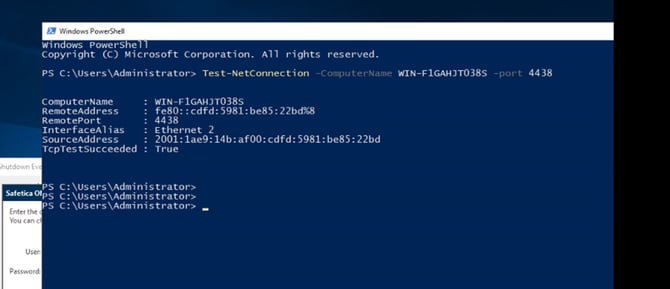
- If you can see the “TcpTestSucceeded” as True, there is a connection. If it is False, you should check the firewall, proxy, or other network appliances to see why it is not accessible.
Cloud/Casb connectivity issues:
Below you can see URL used by Cloud platform.
- *.safetica.com/*
CASB service and Microsoft
You can check again by using PowerShell from your Safetica Server:

Advanced network logs:
If the analysis requires this level of network logs to be collected, this is how you proceed.
- Open STSupportToolSfx.exe:
- Endpoint: “C:\Program Files\Safetica\Tools”
- Server: “C:\Program Files\Safetica Management Service\Tools”
- Click on the [Create application issues report]
- Tick the [Network monitoring logs] checkbox and click on [Run]
- Safetica is now collecting the data. Go and reproduce the issue. Once done, click on [Reproduced] and for the [Report] button to unlock. Then click it.
- Describe the problem and click on [Next]
- Finish the wizard and collect the .sfx output
Wireshark logs:
- Download the Wireshark on the affected endpoint/server
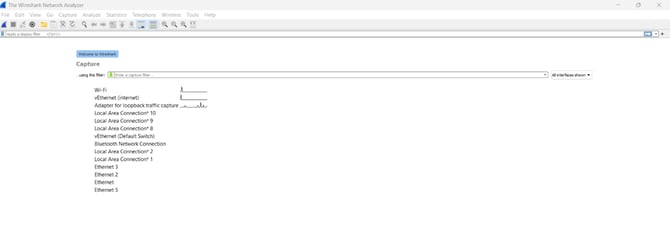
- Run it and choose the network adapter where the outgoing traffic flows
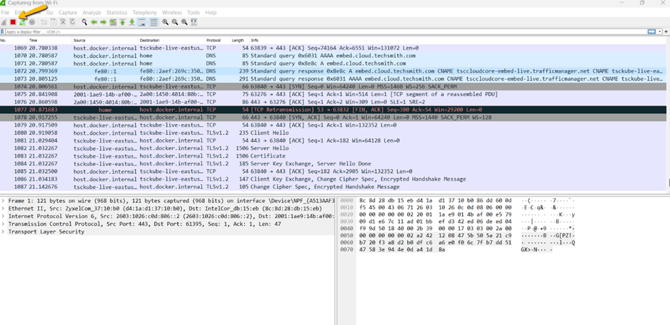
- Wait for some time to capture the issue and stop the network recording by clicking on the red button:
- Click on [File] -> [Save] to export the trace into a file
- Upload the logs from the Safetica Support tool and Wireshark trace log to upload.safetica.com with a description of the issue and the approximate time and date of the occurrence.
MAC OS check connectivity between server and the endpoint:
How to check which server IP/hostname is used for connecting the endpoint
- Open terminal
- Type -sudo /Library/Application\ Support/Safetica/Tools/setup ShowServerIp
How to test connection between mac endpoint and Safetica server
- Open Terminal
- Type: nc -zv “server ip” 4438
- Example:
nc -zv 192.168.2.10 4438 - Check whether there is connectivity.