💻Safetica On-Prem: Content service performance optimization
This article provides a guide how to proceed in case of performance issues with content service.
Applies to: Safetica On-Prem
This article applies both to the new Safetica (version 11) and the legacy Safetica ONE (version 10).
Requirements:
Safetica Maintenance Console
-
- In Safetica ONE – Named Safetica Management Console and available to administrators by default.
- In new Safetica – Renamed to Safetica Maintenance console. Available upon manual installation from here.
How to reveal Safetica processes on the endpoints:
- Disable hiding of the Safetica processes in the Safetica Maintenance Console.
- Go to Maintenance > Endpoint Settings > General Interface Settings > “Hide Safetica processes and folders”.
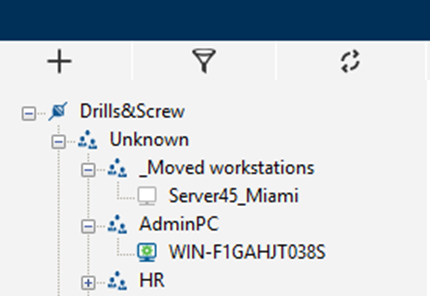
- Select the affected endpoint in the user tree and disable hiding as shown in the screenshot below.

- Then, you can observe high utilization of Safetica processes in the Task Manager.
- For the topic of the Content service, you can find its process named STContentService. If the process resource usage constantly grows, please follow the next sections to read about possible optimizations.
How to resolve the Safetica Content high utilization:
- Skip unnecessary content scanning for secure destinations.
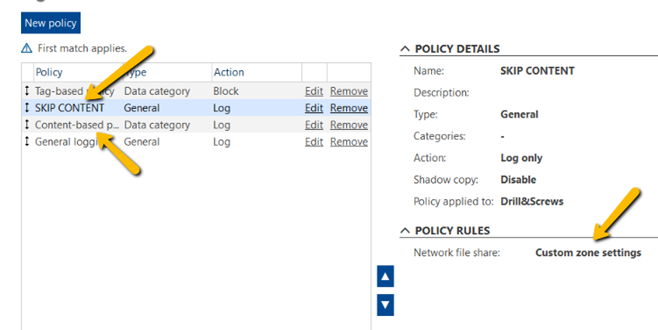
To achieve this, create a new general DLP Policy, select your destination with “Allow” mode, and place this policy above the first policy that utilizes a content-based data category.
- Content-based policy – is the first policy that uses content data category on the list.
- SKIP-CONTENT – is placed above the first content policy to ensure, that in this case copying files to some network destinations specific to the selected zone won’t be scanned.
How to specify the range of the extensions to be scanned
You can help yourself by customizing the specifics of the content category(ies) by going to Protection > Data categories > Configure data category:
- You can turn off the OCR if it is not needed in your case, however, it must be turned off in all categories.

- Also, it is highly recommended to perform content scans only to the ‘recommended’ extension, or ‘custom’. Do not use the ‘All’ option here to get better performance.

- More guidance can be found in How to select file types for content analysis (safetica.com)
Discovery tasks:
- Go to Protection > Data categories, and check your Content-based Data categories for the set discovery task

- If there is any discovery task set, please first revisit the purpose of the task and remove it if it’s no longer needed.
In general, it should be used to gather data about locally stored sensitive data in users’ profiles. Upon the classification task results, you can set up appropriate DLP policies.
- Recommended configuration:

- If you need to set up a Discovery scan for the network share, please follow up this best practice:

- Please notice the following sections:
- For the network Discovery scans, we’re using just one machine whose processing power is going to be utilized.
- We’re choosing a specific network path to limit the number of processed documents and the time it takes to walk through everything.
Logs Collection:
- In the Safetica Maintenance Console, right-click on the affected endpoint and select [Enable Active Management - 1 hour]. Wait until the endpoint icon turns green.

- Replicate the performance issue. Make sure you capture the moment it all starts.
- When the issue is present, create two or three process memory dumps of the STContent service.
- In the Safetica Maintenance Console > Maintenance > Information collection, set up a new collection task, leave the preset configuration, and finish the wizard while selecting your tested workstation in the process.
- Download the generated log files from the console and attach the created process memory dumps. Upload everything to upload.safetica.com along with the information about the date and time of the test.
The issue happens randomly:
If you have a problem collecting the logs at the time when the utilization is high, you can set up the logging on an endpoint for a longer time.
- Go to the Safetica Maintenance Console > Maintenance > Endpoint settings > Logging level > Set to debug level
- Once the issue happens, collect the logs as described above including the additional information