The Safetica console web page is divided into several areas:
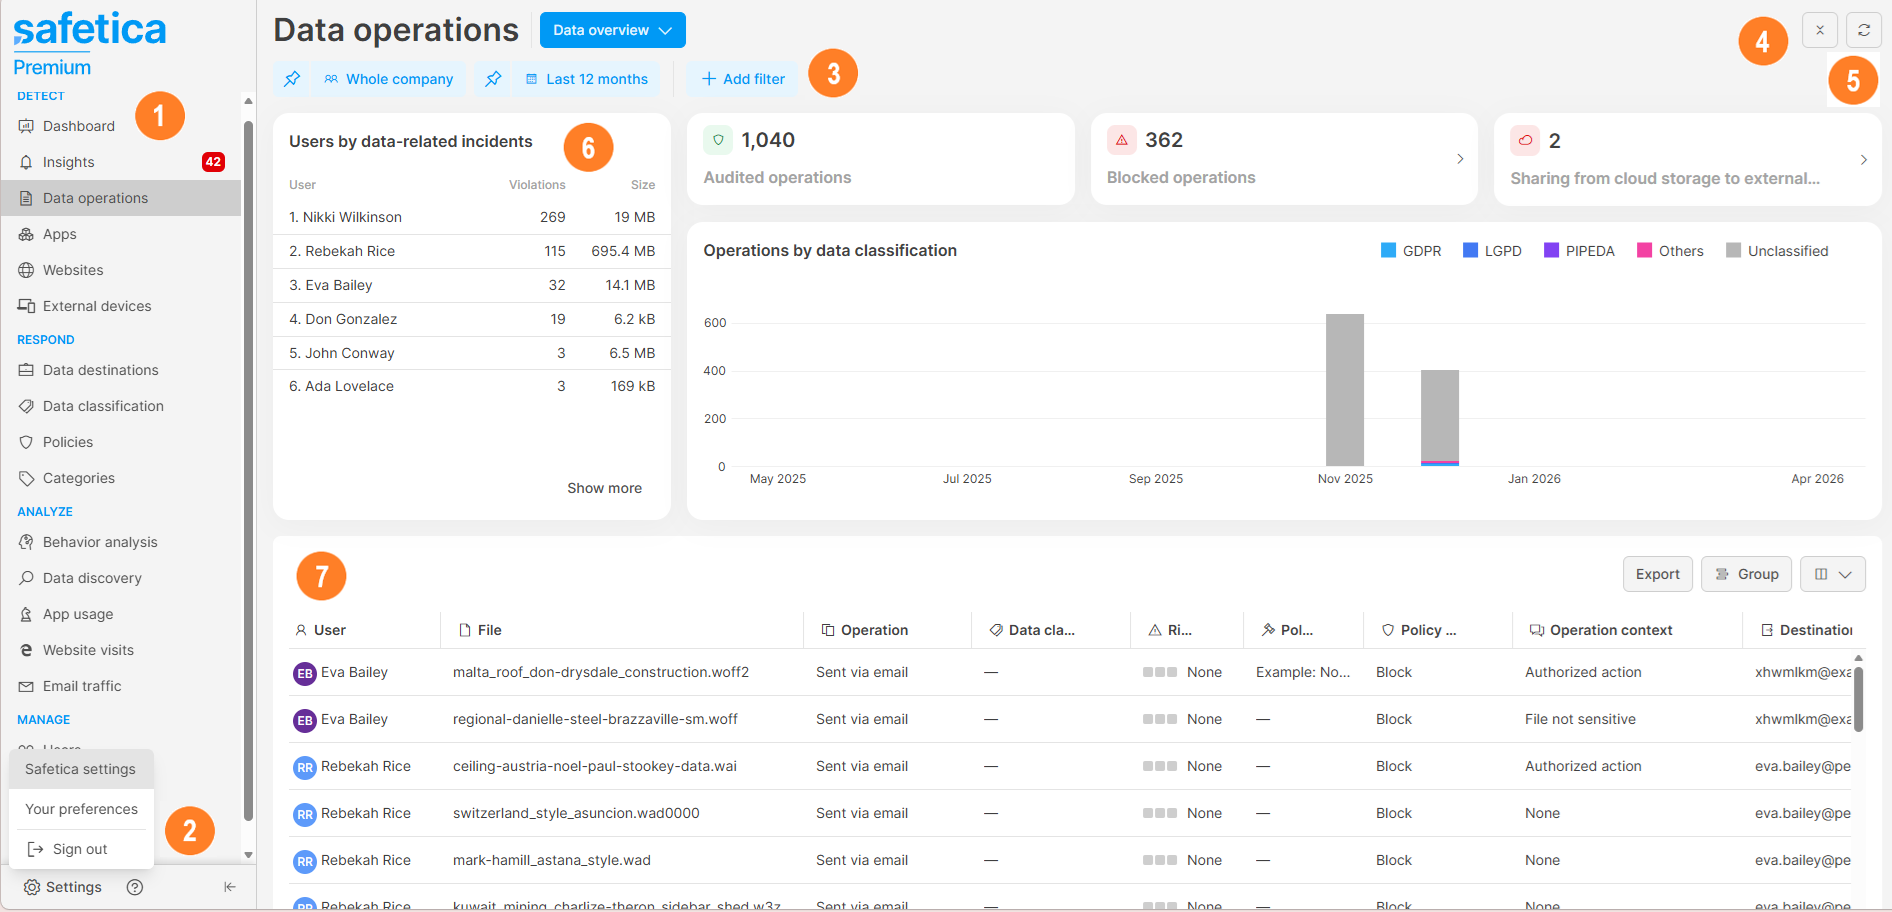
1. Navigation menu
From here, you can navigate to all the sections of Safetica console. The navigation menu is divided into four sections:
-
✨Safetica Platform: Detect, Respond, Analyze, Manage, and Settings
-
💻Safetica On-Prem: Dashboards, Behavior, Protection, Management, and Settings.
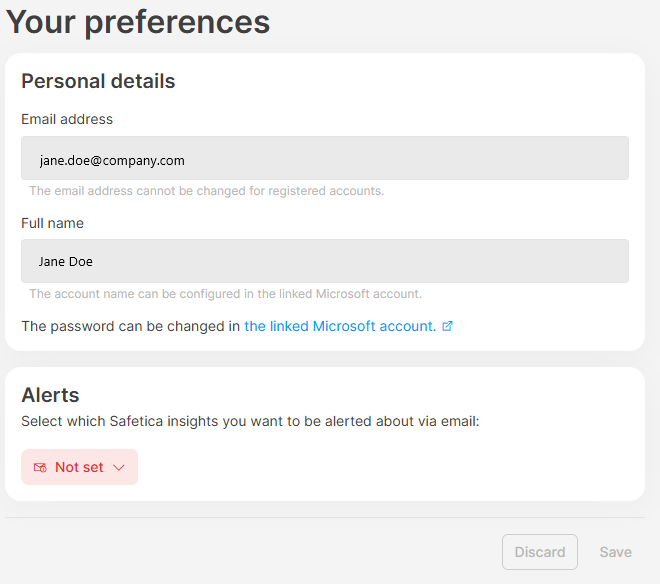
2. Your preferences
✨Safetica Platform:
-
Here you can change the password and set up alerts for your account.

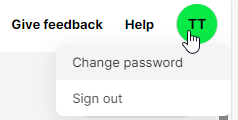
💻Safetica On-Prem:
-
You can sign out and change your password in the top right corner of the screen:
3. Filters
Below the section name, you can set up filters for sections that include records. Buttons for selecting users and time period are always visible. You can add more criteria by clicking the Add filter button. Displayed records will then be recalculated to reflect the applied filters.
4. Collapse/Expand widgets
In sections with graphs and charts, you will find the Hide/Show widgets button that will hide/show the graphs and charts.
5. Refresh page button and additional actions
In most sections, you will find the Refresh page button in the top right corner. In the Devices section, there is also a button to download Safetica Client installer.
6. Widgets
In some sections, you can find graphs, charts, and tables in the upper part of the screen. Some of their elements are clickable. By clicking them, you can quickly filter selected records.
7. Records
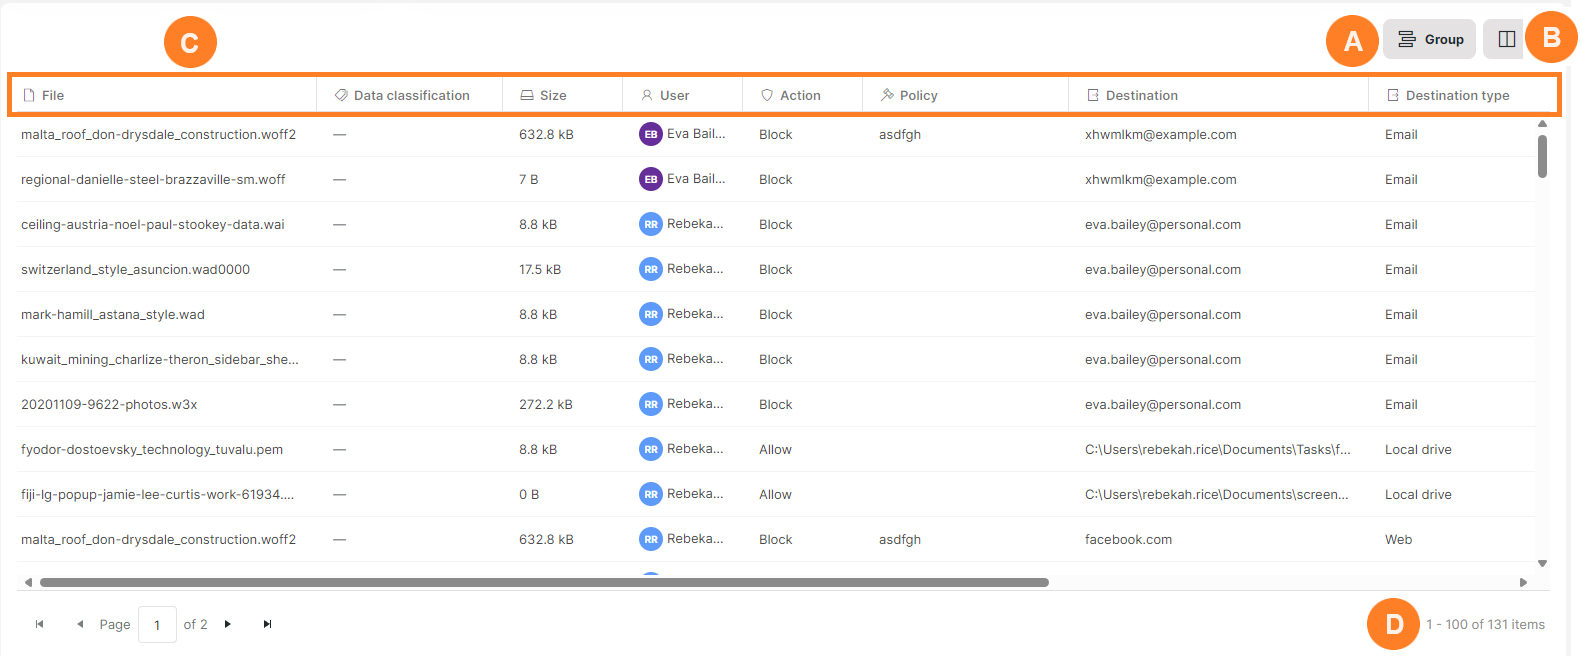
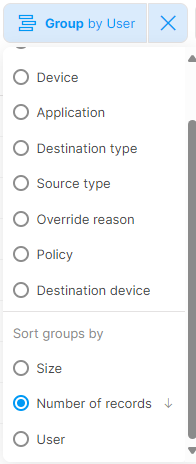
Displayed records may be grouped by selected columns. To do that, click the Group button (A) and select a column to group the records by. You can then choose to sort the groups:
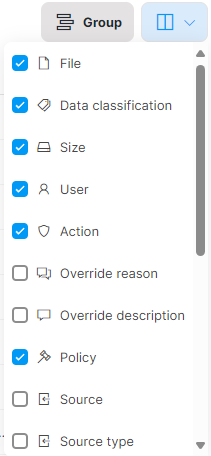
To add more columns to the table, click the icon on the right side (B):
Displayed records may be sorted by clicking the table header (C) and their total number is visible below (D).