How to troubleshoot browser-based issues
Learn how to capture console and network logs from various browsers using the Developer Tools
If you experience ongoing issues with Safetica in your browser, you can try to troubleshoot them in four easy steps:
- Open the developer tools of your browser.
- Collect the console logs by saving them to a file.
- Collect the network logs by saving them into a HAR file.
- Send the logs in a ticket to Safetica Support.
In this article, you will learn in detail how to capture console and network logs for the following browsers:
How to capture logs from Google Chrome, Microsoft Edge, and Firefox
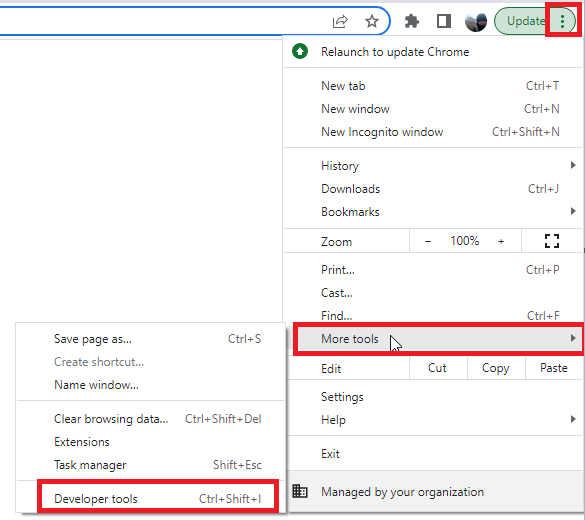
- Open the Developer Tools:
- Click the menu in the top right of the browser (either three dots or three lines).
- Click More Tools and select Developer Tools.

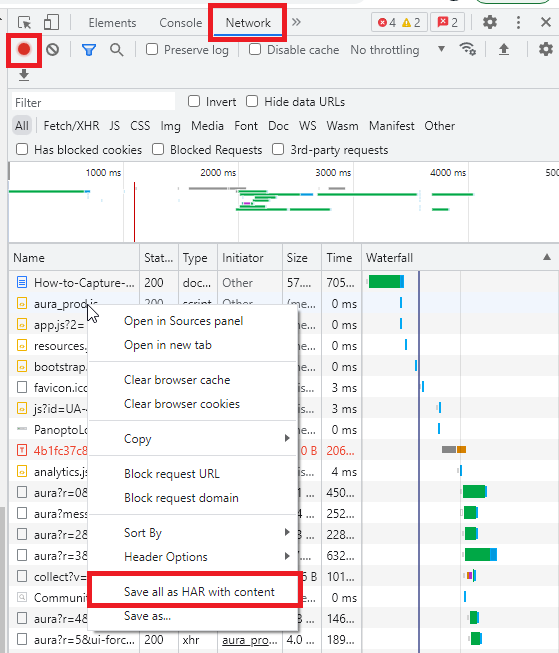
- Collect network logs:
- Select the Network tab.
- Check that your browser is recording (there is either a red circle or a Pause button).
- Reproduce the issue.
- When you are done, click the red circle or the Pause button to stop recording your network data.
- Tick the "Preserve log" option
- Right-click on any of the entries.
- Click Save All As HAR (or Save All As HAR with content) and save the file to your computer.
- Select the Network tab.

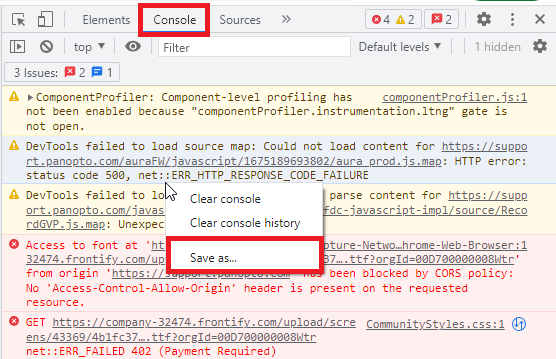
- Collect console logs:
- Select the Console tab.
- Right-click on any of the entries.
- Click Save as… (or Save all Messages to File) and save the file to your computer.
- Select the Console tab.

- Send both files in a ticket to Safetica Support
How to capture logs from Safari
- Open the Web Inspector:
- In the upper left-hand corner, select the Safari menu and then select Settings.
- Select the Advanced tab and check the Show Develop menu in menu bar checkbox.
- Close the Settings window.
- Select the Develop menu in the top navigation and click Show JavaScript Console.
- The Web Inspector will open.
- Collect network logs:
- In Web Inspector, click the Network tab.
- Reproduce the issue in the browser.
- In the Network tab, right-click on any of the entries.
- Click Export HAR and save the file to your computer.
- Collect console logs:
- In your web browser, right-click and select Inspect Element.
- When the Inspect Element widget appears, select the Console tab.
- Right-click on any of the entries.
- Click select Save Selected and save the file to your computer.
- Send both files in a ticket to Safetica Support.