💻Safetica On-Prem: How to resolve issues with web resource inaccessibility and collect logs
This article provides a guide on how to proceed in case of issues related to web resources.
Applies to: Safetica On-Prem
In this article, you will learn more about:
- Requirements
- Setting up SSL exclusions
- Data policies - destination type: Other network connections
- Collecting logs
Requirements
1. Safetica Maintenance Console
-
- In Safetica ONE – Named Safetica Management Console and available to administrators by default.
- In new Safetica – Renamed to Safetica Maintenance Console. Available upon manual installation from here.
2. Review exceptions for Safetica in your other security solutions: How to set up exceptions for Safetica Client in your antivirus
Setting up SSL exclusions
- In Safetica Maintenance Console > Maintenance > Integration settings, you can add the URL, IP address, or IP address range to the Trusted servers list, which means our SSL inspection will not intercept or affect their SSL/TLS network communication.

- By adding an address to Trusted servers, only website policies are affected - the website will no longer be blockable by Safetica. However, data policies for the Web upload destination type will remain working because they are handled by a different technology.
- Once the device receives the settings, restart the browser, and try to access the website again to see if the issue is still present.
Data policies – destination type: Other network connections
In older versions of Safetica ONE (version 10 and older), the Other network connections destination type used to be the main feature for controlling data flow towards the network. Safetica later identified the main use and introduced controlling the main scenarios separately by adding the Web upload and Network file share destination types.
-
Review policies that used to include Other network connections and replace its purpose with Web upload and Network file share instead.
-
Once you create your policies, remove Other network connections from use (Safetica ONE (version 10 and older) only).
Collecting logs:
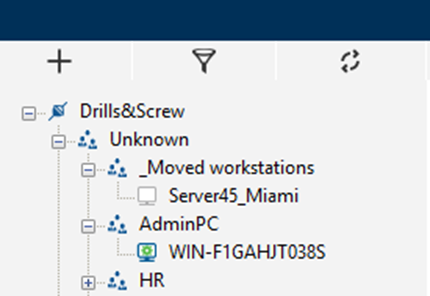
- In Safetica Maintenance Console, right-click the affected device and select Enable Active Management – 1 hour. Wait until the device icon turns green.

- Run STSupportTool.exe. You can find it either:
- on the affected device in C:\Program Files\Safetica\Tools, or
- on the Safetica Server in C:\Program Files\Safetica Management Service\Tools
- Click Create application issues report.
- Check the Network monitoring logs checkbox and click Run.
- Reproduce the issue. Once done, click Reproduced and wait for the monitoring to finish.
- Click Report, describe the issue, and proceed by clicking Next.
- Finish the wizard and upload the obtained .sfx output to upload.safetica.com.