💻Safetica On-Prem: How to collect logs for external device issues
If you encounter a problem related to external device policies or to external devices in general, please proceed with the steps described below.
Applies to: Safetica On-Prem
In this article, you will learn more about:
Requirements
1. Safetica Maintenance Console
-
- In Safetica ONE – Named Safetica Management Console and available to administrators by default.
- In new Safetica – Renamed to Safetica Maintenance Console. Available upon manual installation from here.
2. Review exceptions for Safetica in your other security solutions: How to set up exceptions for Safetica Client in your antivirus
3. Read information about narrowing down the source of an issue: How to isolate the source of an issue in Safetica Maintenance Console
Collecting logs for external device issue:
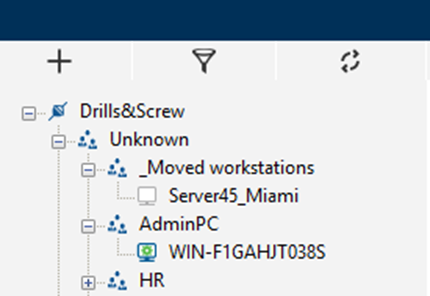
- In Safetica Maintenance Console, right-click the affected device in the user tree and select Enable Active Management > 1 hour. Wait until the device icon turns green.

- Restart the affected device.
- Plug the problematic external device in, replicate your problem, and keep the external device connected until you obtain the .sfx output.
- On the affected device, go to C:\Program Files\Safetica\Safetica Management Service\Tools and run STSupportTool.exe
- Click Prepare the information pack.
- Describe the issue and proceed with Next.
- Click Run.
- Finish the wizard. In the end, when everything is done, you’ll obtain an encrypted .sfx archive.
- Now collect the same logs when the device works correctly. (Utilize your mitigation findings from the article about the issue isolation.)
- Upload both .sfx logs to upload.safetica.com with the information about the affected external device, time, and date of the replication. If you can collect the info about the device HW id, please include it.