Applies to: Safetica On-Prem and Cloud
In this article, you will learn more about:
- Requirements
- How to isolate the source of an application-related issue
- How to narrow down the source of an issue related to external devices
- How to narrow down the source of a website-related issue
- Other information we need from you
Requirements
1. Safetica Console
2. Safetica Maintenance Console for on-prem
3. Review exceptions for Safetica in your other security solutions: How to set up exceptions for Safetica Client in your antivirus
How to isolate the source of an application-related issue
If you have an application-related problem from the period when Safetica was installed as well, you can proceed with the troubleshooting as follows:
Deactivate Safetica Client
Safetica Client can be deactivated both in the new Safetica console (version 11.3.17+) and in Safetica Maintenance Console.
For steps in the new Safetica console, read this article.
To deactivate Safetica Client in Safetica Maintenance Console:
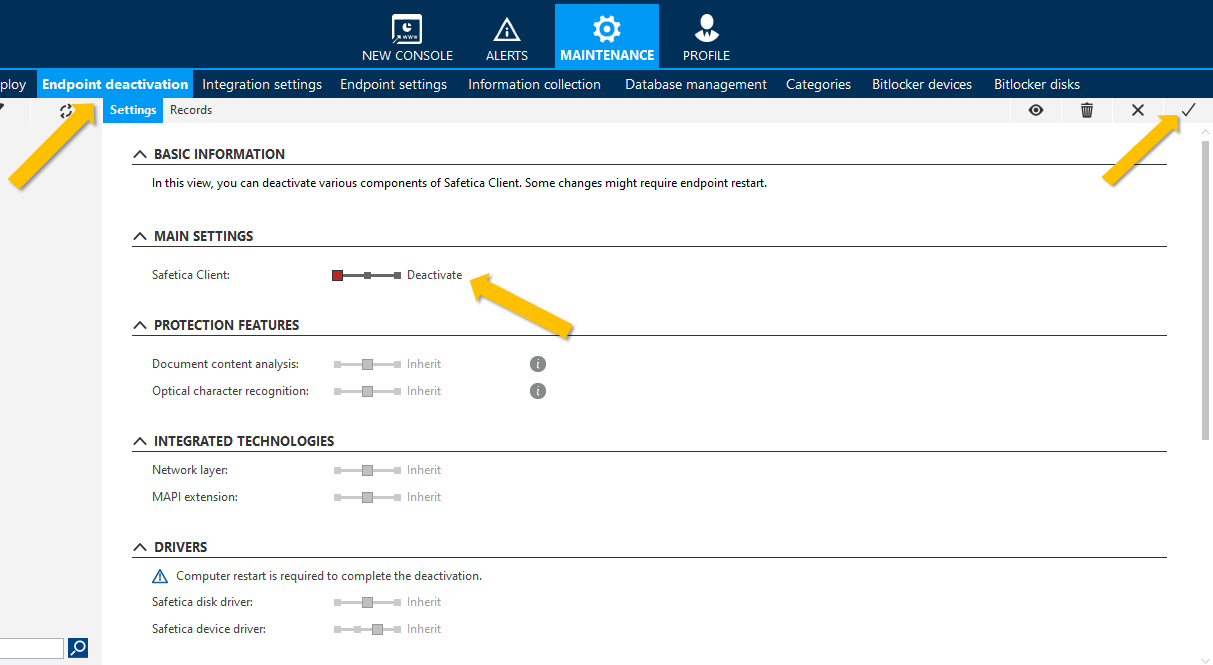
- Navigate to Safetica Maintenance Console > Maintenance > Endpoint deactivation.
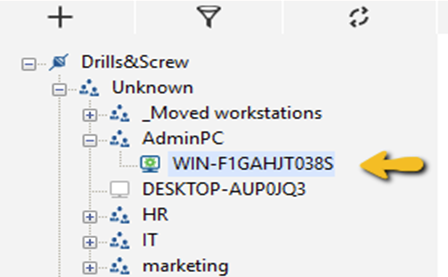
- Locate the device in the user tree on the left, select it, and set the Safetica Client to Deactivate.
- Save this setting by clicking the confirm button in the top right corner.
4. Check in the user tree, if the device is deactivated (it will have an SA icon).
5. Restart the device and check if the issue is still present.
6. If the issue is still present, it is not related to Safetica, and you should check other applications installed on the device.
7. If the issue is resolved, continue with the next section Deactivate specific modules.
Deactivate specific modules (Onprem only)
-
In Safetica Maintenance Console, right-click the affected device and select Enable Active Management – 1 hour. Wait until the device icon turns green.

-
Go to Maintenance > Endpoint deactivation.
- If the Client is fully deactivated, reactivate it before proceeding with the next steps.
- Deactivate modules from the categories below (step 6) one by one based on your issues. Do not forget to always save the setting by clicking the confirm button in the top right corner.
- Take notes of whether anything helped and what was the time difference (if relevant).
- Wait a minute after each deactivation, restart the application, and reproduce again. You can confirm whether the module is deactivated in the Visualization tab.
- Outlook issues: deactivate MAPI extension + Safetica DLP service (might require device restart to take full effect)
- Website performance issues: deactivate Safetica user interaction service + Safetica net monitor service + Safetica DLP service (might require device restart to take full effect)
- File operation performance issues, Resource usage spikes: deactivate Safetica content analysis service + Safetica file monitor service + Safetica DLP service (might require device restart to take full effect)
6. If the only solution was the deactivation of the DLP service, you can proceed with the next article segment Turn off the integration. Otherwise, proceed with log collection.
Turn off the integration
Check also optiom how to tur off integration/protection in the Cloud console and new console.
- Open Safetica Maintenance Console > Maintenance > Integration settings > Application integration.
- Find the process of your application and check if it is integrated.
- If the integration state is set to active, you can set it to inactive and restart the process/application.
- If you want to ensure the process didn't remain integrated, you can check this link
- If the issue is resolved, you can keep it as a solution, unless you need the following features for the application/process:
- Integration state switch: Extended visibility of the application’s operations, and ability to classify the application’s outputs.
- Integration into application’s operations switch: Ability to block operations like a clipboard.
- Integration into network communication switch: Ability to capture the application’s network traffic for data protection.
- If the issue is not resolved, check any other processes launched along with the application in the Task Manager on the device and try deactivating them. If no solution is found, proceed to log collection.
How to narrow down the source of an issue related to external devices
Safetica uses its own device control driver to control what external devices can and can’t be connected to the users’ devices. Filtering various types of external devices or being on the same stack with other vendors can, for some, result in a potential conflict. These are the options you have to resolve the issue or collect the information for the resolution:
Whitelist external devices
- Whitelisting external devices serves not only as a validation that issues are caused by Safetica, but for many it can also be a solution for incompatibility. This article describes how it’s done.
- If adding the device's HW ID to Problematic devices did not resolve the issue, see whether the device is part of any data destination groups (zones). If it is, remove it from there. Otherwise, you can proceed with the section Stop the device control driver.
Stop the device control driver (onprem only)
- By stopping the device control driver, you can verify whether Safetica is causing the issue or if the source of the issue lies somewhere else.
- To stop the driver, go to Safetica Maintenance Console > Maintenance > Endpoint deactivation, select the device with the issue from the user tree on the left-hand side, and set Safetica device driver to Remove. Then save the settings in the top right corner.
- Wait for a few minutes for the changes to apply and restart the device for the driver to unload.
- If the issue persists, then Safetica was not part of it. You can proceed with reviewing your other solutions. If the issue is resolved, you can proceed with log collection.
-
To load the driver, change its deactivation back to the previous state and restart the device again.
How to narrow down the source of a website-related issue
Deactivate Safetica Client
Safetica Client can be deactivated both in the new Safetica console (version 11.3.17+) and in Safetica Maintenance Console.
For steps in the new Safetica console, read this article.
To deactivate Safetica Client in Safetica Maintenance Console:
- Navigate to Safetica Maintenance Console > Maintenance > Endpoint deactivation.
- Locate the device in the user tree on the left, select it, and set the Safetica Client to Deactivate.
- Save this setting by clicking the confirm button in the top right corner.
4. Check in the user tree, if the device is deactivated (it will have an SA icon).
5. Restart the device and check if the issue is still present.
6. If the issue is still present, it is not related to Safetica, and you should check other applications installed on the device.
7. If the issue persists, collect the logs according to this article.
Setting up SSL exclusions in Safetica
New article for Cloud and new console -
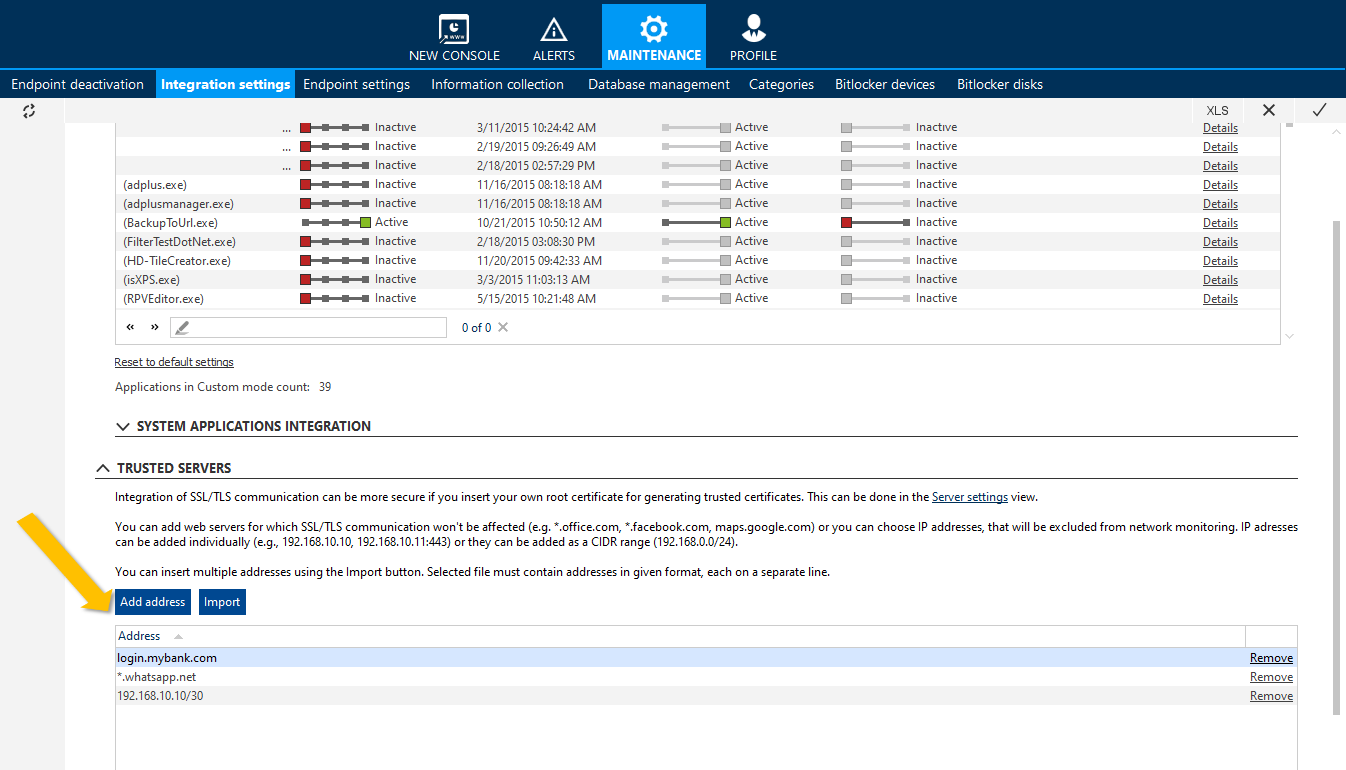
- Open Safetica Maintenance Console > Maintenance > Integration settings > Trusted servers.
- Add the affected address and save the settings with the confirmation button in the top right corner.

- Wait for the changes to apply and then test the website again.
- If it resolved the issue, you can leave the website on Trusted servers, unless you need to control the access to this website by website policies (Webcontrol feature).
If you are still experiencing problems with the websites, follow up with this article dedicated to this topic.
Other information we need from you
How many users are affected?
What is the version of the operating system and application?
What scenario are you trying to achieve?