Applies to: Safetica On-prem and Cloud
In this article, you will learn more about:
- Requirements
- Collecting logs - when the issue is reproducible on demand
- Collecting logs - when the issue is occurring randomly
- Collecting logs - when you can't determine the culprit of high resource utilization
Requirements
2. Read information about narrowing down the source of an issue: How to isolate the source of an issue in Safetica Maintenance Console
Collecting logs - when the issue is reproducible on demand
- In the Safetica Console, go to the Devices > Device detail > Run troubleshooting and wait for activation

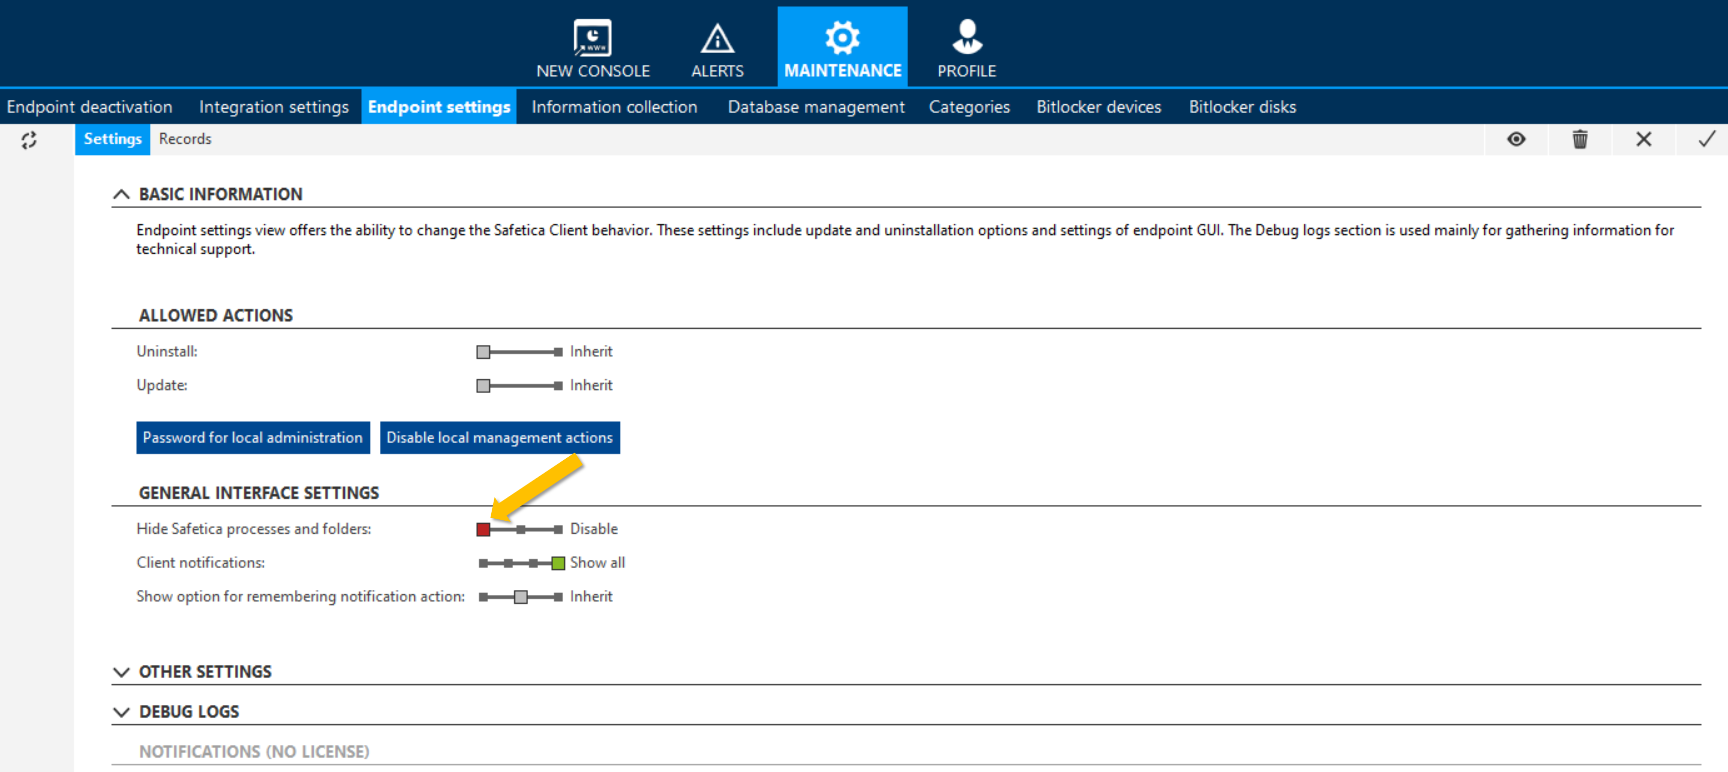
- For On-prem - Go to Maintenance > Endpoint settings > General interface settings and set the Hide Safetica Processes and folders option to Disable for the affected device.

For Cloud - you should be able to see Safetica processes if you run as administator tools like processexplorer or system informer - On-prem - Once the device receives the setting, Safetica processes will be visible in Task Manager.
- On the affected device, go to C:\Program Files\Safetica\Tools and run STSupportTool.exe.
- Click Create application issues report. Leave all options as they are and click Run. The monitoring begins.
- Go to Task Manager and find the most utilized process in the Details tab (highest RAM, CPU). You should focus mainly on Safetica processes. Right-click them and select Create memory dump file 2-3x times per process.

- Once done, go back to Safetica Support Tool and click Reproduced. Once the log creation is finished, click Report.
- Describe the problem and click Next.
- Click Run and wait until logs are collected.
- Upload the collected support package along with the dumps to upload.safetica.com with information about the date and time of the performance spike occurrence. You can also attach a print screen of the most utilized processes at that time.
Collecting logs - when the issue is occurring randomly
If you have a problem catching the performance issue because it occurs randomly, you can first provide us with logs collected in the following way. However, dumps are very important, and we cannot guarantee that we will be able to pinpoint the issue.
- In Safetica Console > Device > Endpoint detail, Run troubleshooting for more days

- It will be set for 7 days. Wait until the issue appears.
- Once replicated, proceed with the next step to collect the logs. Be aware that they should be collected as soon as possible because the size limit of the log database on the device shrinks automatically.
- Download the collected log files. Upload everything to upload.safetica.com along with the information about the date and time of the replication.
Collecting logs - when you can't determine the culprit of high resource utilization
WPR tool:
There may be a situation when you are unable to provide us with dumps because you are not sure which process(es) causes the high load on the system.
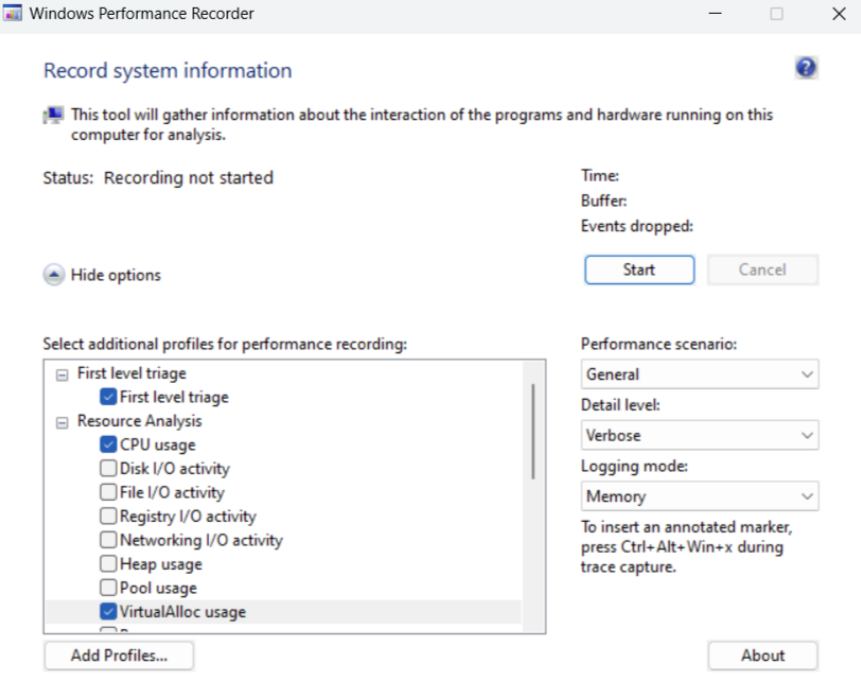
In this case, you can use the Windows Performance Recorder (WPR) tool.
This tool allows you to see the most used process and what is happening on your device. However, be aware that the tool has a slightly higher impact on the system.
- See the following article to get the Windows Performance Recorder.
- After installing the Windows Performance Recorder, start it and set it up as follows:

- Click Start to begin monitoring.
- After the issue is reproduced, click Stop and finish the wizard to obtain the log files.
- Upload the WPR along with the Safetica logs to upload.safetica.com.