Working with records, viewing them, and gaining important info from them is simple and intuitive in Safetica.
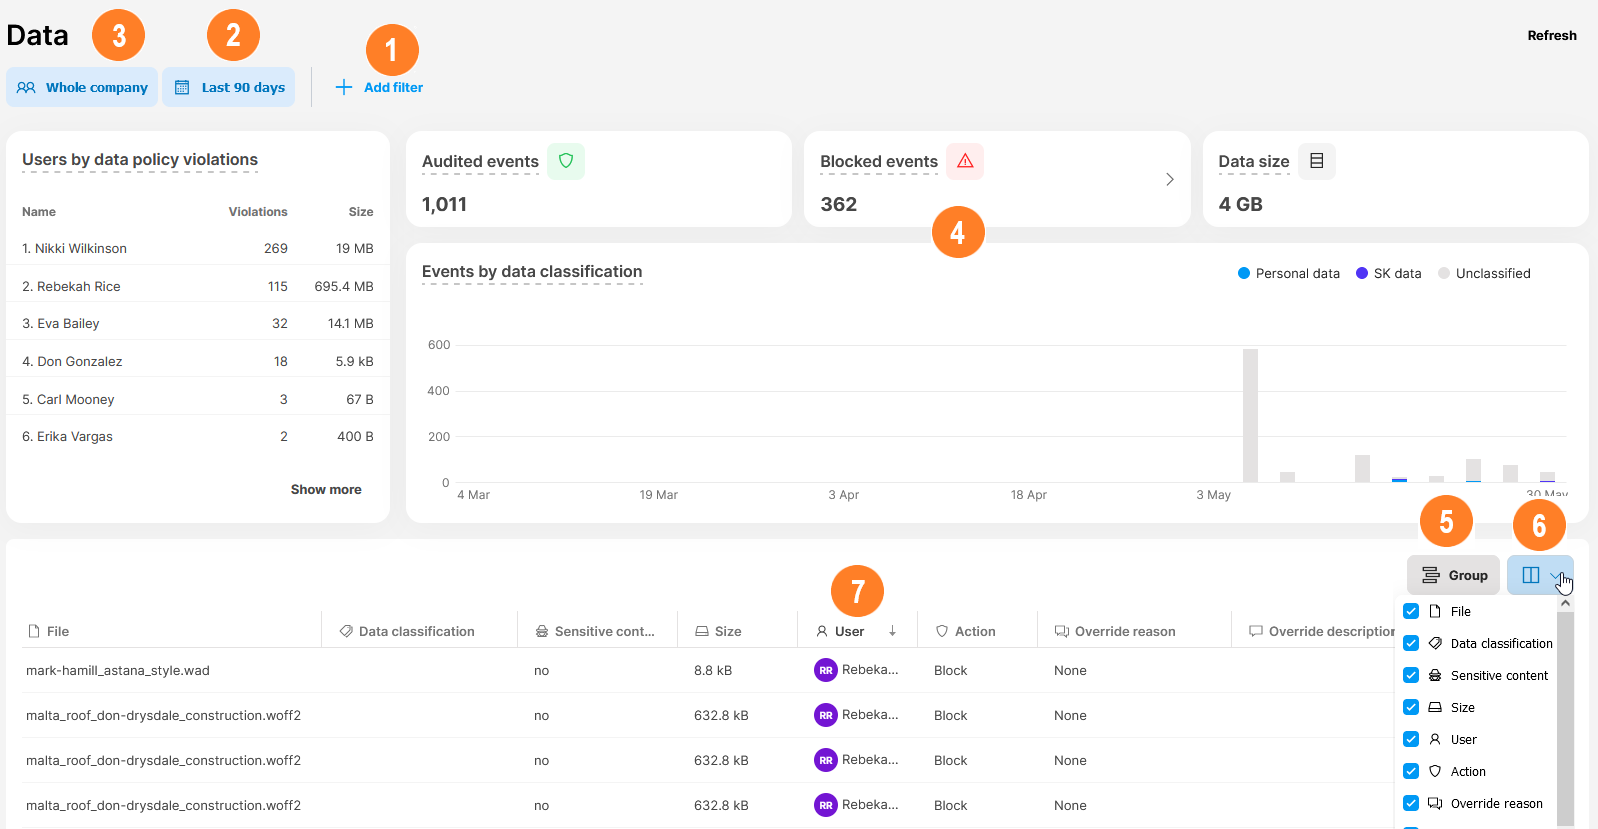
1. Filters in Safetica
You can filter records related to data, apps, websites, or users based on many things, such as destination, file size, the action taken by protection policies, the application used, and many others.
✍️These filters are temporary so that when you leave the section, they are cleared.
Example: Blocked file copying to USB
Find if there were any attempts to copy files to USB drives that were blocked by protection policies. This will help you see whether there were any potential attempts to leak data.
Example: Display files with specific data classifications and their details
See what files were matched with the Personal, Health, and Finance data classifications. Then display all classification details for the export.zip file.
Example: See what social networks are used in your company
See what social networks are used in the company, who uses them, how much time users spend on them, and if any file transfers to social networks were blocked by your policies
Example: See if people in your company play any games
See what games are played by the users in your company, who plays them, and how much time users spend playing.
2. Date picker
Via the date picker, you can select a specific time period (from Last 24 hours up to Last year).
✍️This filter is persistent. It remains set even after you visit a different section.
Example: Set a date range
Filter out the Design team and then change the time picker to Last 30 days. See how the record table changes.
3. User filter
You can select with great granularity which particular teams, users, and devices to display. 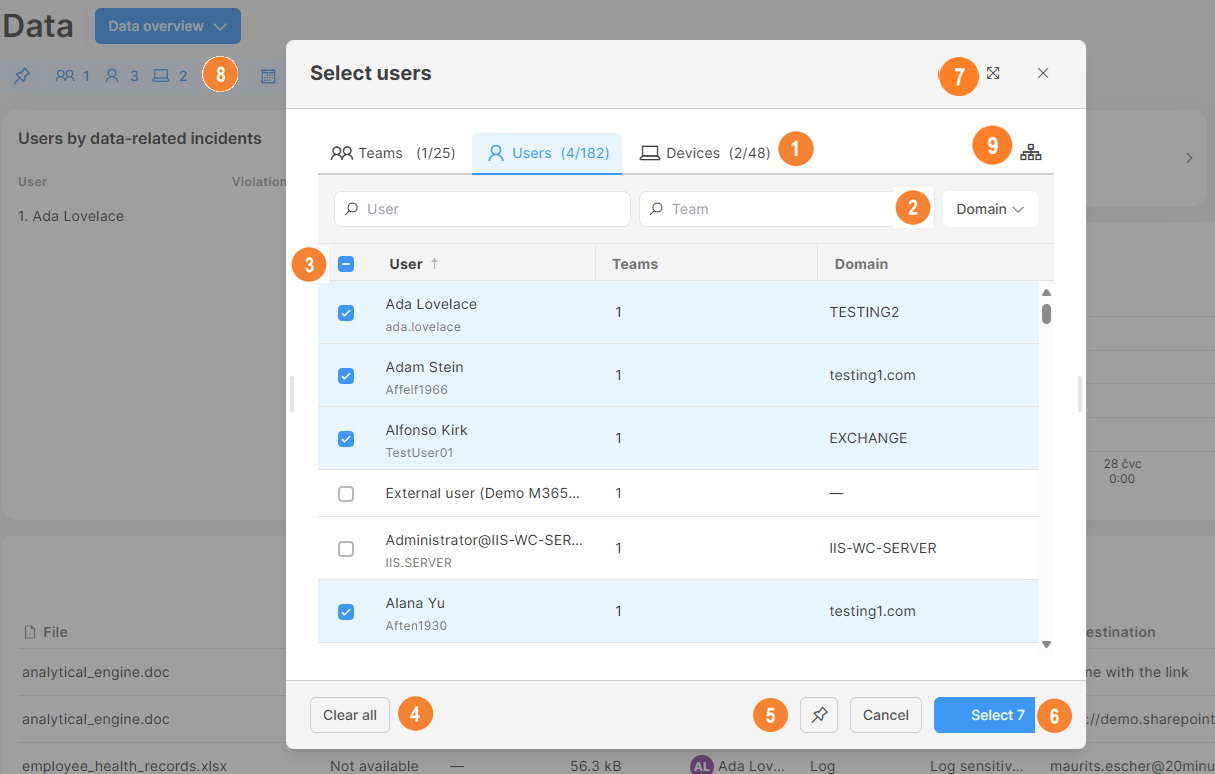
- Tabs: Three separate tabs for selecting users, teams, and devices.
- Search boxes: Within each tab, you can search for the particular entity you need to find.
- The search is not case sensitive or diacritic sensitive.
- In the Users tab, search takes into account both the username and the login name (e.g., both Ada Lovelace and ada.lovelace).
- Customers with multi-tenant environments can choose a particular domain to narrow down the search even more.
- Multi-selection:
- Click the upper checkbox to select up to 100 rows at once.
- Supports multi-selection via Shift + click and Control + click.
- Clear all: Clears selection from all tabs and returns the user, teams, and device filter to Whole company.
- Pin the filter: Click the Pin icon to make the filter persistent across all sections of Safetica console. This way, the filter will remain set even after you visit a different section.
- Select: Confirm your selection with the Select button. You can always see how many users, teams, and devices were selected across all tabs in the filter.
- Expand the filter to the whole screen. You can also move the filter or resize it by dragging its left/right sides.
- After confirming the selection, the filter will show the number of selected users, teams, and devices.
-
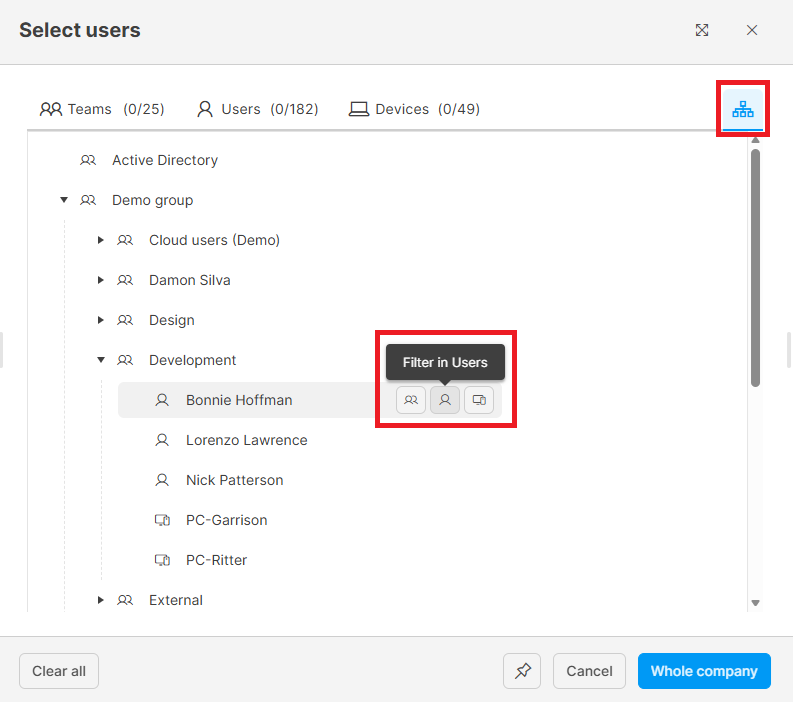
View the user tree: Click the icon on the right to view your users, devices, and groups in the tree structure. Hover over individual nodes in the tree to see available actions: Filter in Teams, Filter in Users, Filter in Devices. Clicking them will take you straight to the corresponding tab with the correct filtering set.
4. Charts and tiles
Charts and tiles present data in easy-to-consume form. Most of them can be clicked to filter out interesting info.
Example: Display blocked file operations
See all events that were blocked by policies.
Example: See who worked with a specific data classification
See if users worked with any personal data, if any events with personal data were blocked, and how much data matched the Personal data classification.
Example: See who violated policies
List all users by how much they violate protection policies.
5. Grouping of records
Grouping serves to streamline the visualization of filtered records. It is most flexible in the Data and Behavior sections.
You can group records based on many columns, e.g. based on user, application, destination type, etc. Afterward, you can sort the groups by name, size, or the number of records.
Example: Display the most popular data destinations
See to what destination types were most operations targeted, and to what destination types was the biggest amount of data transferred.
The Apps and Websites sections are more predefined. The records are grouped by default within individual tabs, i.e. they are grouped by:
- Applications/Websites
- User – records are grouped by username. Sort the displayed groups via the Group by button by Active time, Number of records, or alphabetically by Sorting changes the Sum values and the order of the users.
- App/Web category - records are grouped by App/Web categories. Sort the displayed groups via the Group by button by App category, Active time, Number of records, or alphabetically by Sorting changes the Sum values and the order of the app/web categories.
- Blocked activity – in this tab, you can see the records of blocked applications/websites and the policies that triggered the blocking.
6. Customizing visible columns
You can add or hide columns based on your needs via the column picker. You can also change their order or size.
The Refresh button refreshes the whole page (i.e. data in the table).
7. Sorting columns
Some columns can be sorted – not all, however, only those where it makes logical sense.
✍️You can create a virtual report by bookmarking the URL of a page with set filters.
Read next:
How to create a virtual report