Applies to: Safetica On-Prem
Looking for the Safetica Platform version? See: Safetica Platform: How to set up email alerts.
✍️To set up alerts for incidents happening in your environment, you need the companion Safetica Maintenance Console.
Introduction: Why use alerts
Being informed about data loss, insider threats, and risks is the key to mitigating and reacting to these events. To get notified about significant events in data auditing, configure real-time or periodic alerts. Alerts are sent immediately after the operation that triggered them or daily just after midnight.
Limitations
- 🍏macOS: Alerts in Safetica Maintenance Console are not available for macOS.
How to set up a new alert
To set up a new alert:
- Open the Safetica Maintenance Console and click Alerts in the upper menu. Alerts are set up for the server selected in the user tree on the left.
- Click the Settings view and then the New rule button. For each alert set, you can:
- Specify its name and description.
- Select which alerts will be sent (you can select multiple alerts from the lists). Alerts are divided into three main categories:
- Specify the users, groups, or devices for which the alert will be active.
- You can also set up a connection to your SIEM / servers supporting Syslog. Learn more about sending your alerts to SIEM here.
- Enter one or more email addresses that receive the alert.
✍️To send alerts via email, you must configure an SMTP server in Profile > Server settings > Outgoing (SMTP) mail server.
✍️If you do not enter any email addresses, the alerts will be shown in Safetica Maintenance Console instead. You will see a number above the Alert icon representing the number of unread alerts.
f. In the last step of the configuration, click Finish, and the newly created alert set will be added to the alert list.
3. To save the changes, click the ![]() button on the upper right.
button on the upper right.
4. If a user performs an action that triggers an alert, the alert is sent. Its record also appears in the Records view of the Alerts section.

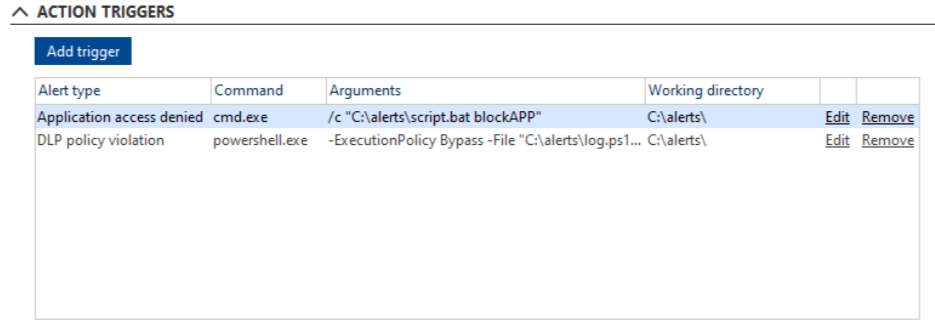
What are action triggers
Action triggers let you automatically run a command or script with specific arguments in a selected folder whenever an alert is triggered. The command runs on the device with Safetica Client, under the account of the user who caused the incident. These settings apply server-wide.
❗Before you configure an action trigger, make sure the alert you want to use is already set up. If it isn't, the trigger won't activate
✍️The command runs immediately after the alert is triggered. Exact timing depends on the alert's configuration.
How to configure an action trigger
- Open the Safetica Maintenance Console and go to Alerts > Settings.
- In the Action triggers section, click Add trigger (or click Edit to modify an existing one).

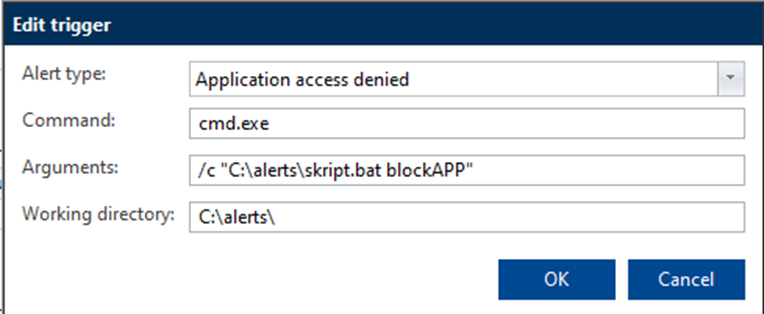
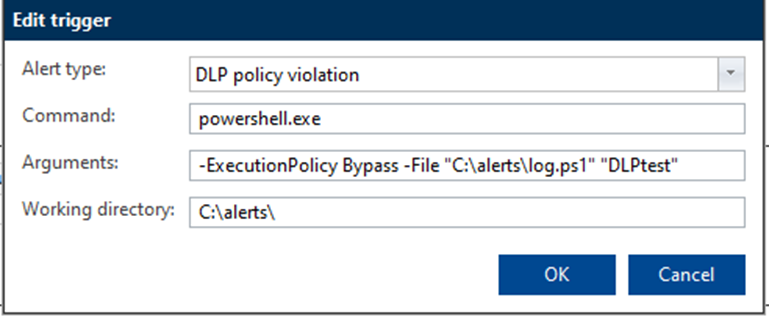
- From the Alert type dropdown, select the alert that should activate the trigger (for example, Application access denied or DLP policy violation).


- In Command, enter the executable that will run the script (e.g., cmd.exe or powershell.exe).
- In Arguments, enter the parameters to pass to the command, including the path to the script and any additional arguments.
- In Working directory, enter the folder where the command should run.
- Click OK to save.
✍️ Once saved, the trigger is active and runs automatically each time the selected alert is triggered.
What can you see in the Records view
All alerts are recorded, and you can see them in the Records view of the Alert section.
✍️Records of alerts in Safetica Maintenance Console are visible only to the admin who created the alert.
In the upper part of the view, there are statistics and charts. In the bottom part, there is a list of generated alerts. Click a statistic in the upper part, and the bottom part will display only the relevant alerts. New alerts that have not yet been displayed are highlighted.