Applies to: Safetica On-Prem and Cloud
In this article, you will learn more about:
Requirements
Safetica ConsoleReview exceptions for Safetica in your other security solutions: How to set up exceptions for Safetica Client in your antivirus
OS crashes:
OS crashes can be quite sporadic and unpredictable. From our experience, the majority of them are caused on the network level by outdated network adapter drivers. Review them as the first option and if the OS crash occurs again, proceed with the logs collection.
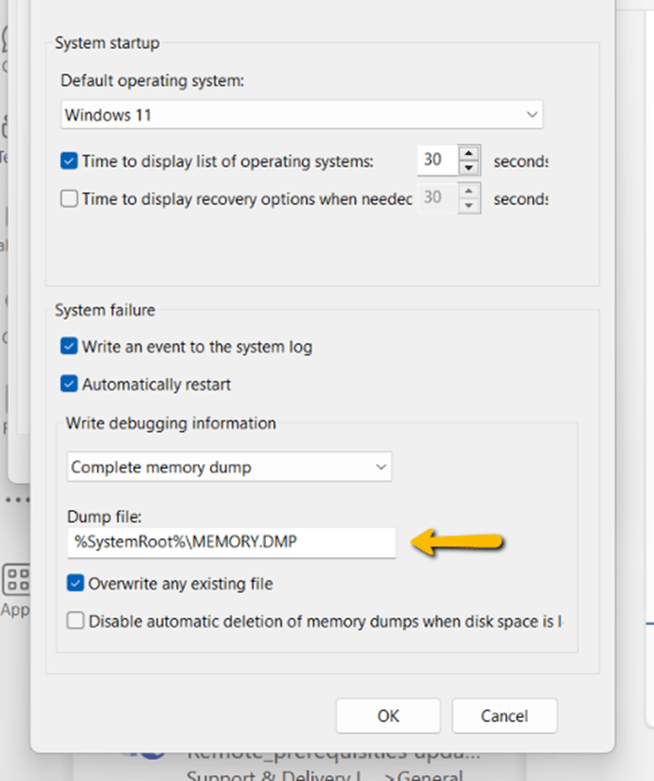
- Begin with checking the level of your memory dump in the following Windows settings:
- In the Control Panel, select [System] and Security > System.
Select [Advanced system settings], and then select the [Advanced tab]. - In the Startup and Recovery area, select [Settings].
- Under "Writing Debugging Information" select the "Complete memory dump" option.
- Restart the computer
- Wait for the crash to happen
- Collect the memory dump in the default path “C:\Windows” or the path you've previously set up - marked with the yellow arrow.
- Compress the memory dump into an archive and upload it to our upload server https://upload.safetica.com. Do not forget to fill in the ticket ID so the logs are assigned to the correct ticket.
Application crashes:
If an application crashes, we would need to isolate the source of the issue first and then get logs and dumps of the affected application process.
Isolating the source of the issue:
Firstly, review the following article which will help you to isolate the source of the conflict between the application and Safetica.
How to isolate the source of the issue
Log collection:
- In Safetica Console, go to Devices > Device detail > Run troubleshooting and wait for activation.

- To get the dump from the crashing application process use the procdump tool as described in the next steps. You can find it in this path - C:\Program Files\Safetica\Tools\procdump.exe More information:ProcDump - Sysinternals | Microsoft Learn
- Run CMD as administrator
- Create a folder for dumps like “C:\Dumps”
- Execute commands:
- cd C:\Program Files\Safetica\Tools\
- procdump.exe -ma -i c:\Dumps
- Now the procdump is installed like a post-mortem, keep the CMD open
- Replicate the situation with a crash, please do this several times.
- Check that the dumps are created after the crash of the application.
- If the dumps are created, you should uninstall the procdump.exe set as postmortem by executing the command: procdump.exe -u
- In the Safetica Console > Devices > Collect device log, set up a new collection task, leave the preset configuration and finish the wizard while selecting your tested workstation in the process.
- Download the generated log files and attach the affected image file. Upload everything to upload.safetica.com along with the information about the date and time of the test.