Drilling into incident details in Safetica
Learn how Safetica interlinks info from various product sections to facilitate incident investigation. See examples of how website, data, and app details help you investigate incidents, understand policy violations, and take appropriate actions.
In Safetica, details about data, apps, websites, and other events interlink info from various sections of the product and streamline the flow of incident investigation.
In this article, you will learn:
- What can you see in the detail
- Example: website detail
- Example: data detail
- Example: app detail
- Example: classification detail
- ✨Safetica Platform only: Example: risk assessment detail
✍️Details always show history from the last 7 days. If you need a longer time frame, you can click a button under the 7-day list to view all actions.
What can you see in the details
In details, you can find info such as applied data classifications, app or website categories, details about top users (listed by active time), what policy was violated and what action was taken by the policy, links to filter out all operations that were blocked by a policy, and many more.
Example: How website detail empowers your investigations
✍️The website detail offers info about both blocked website visits and blocked data uploads to provide the context of all noteworthy security events related to a website.
The admin is suspicious of Facebook activities. They want to investigate what data was uploaded to Facebook and what activities on Facebook were blocked by policies.
Example: How data detail empowers your investigations
The admin sees a suspicious file and wants to investigate it in detail – see problematic operations, users who worked with the file, and actions taken by policies to protect the file. Watch the video to see how it is done.
For some files, you can see the Correlation ID in the file detail. It helps you identify files even if they have been modified (changed name, duplicity files, etc.). Click the correlation ID to filter your records and see what has been happening with the specific file.
Example: After clicking the correlation ID in the employee_health_records.xlsx file detail, the admin can see that the original name of the file was different before being uploaded to the web.
Example: How app detail empowers your investigations
The admin looks through application categories and notices an issue – there is Notepad in the Text editor category, even though Notepad is forbidden in the company. They decide to check who used the app and what operations were blocked by policies. Watch the video to see how they investigate.
Example: How classification detail empowers your investigations
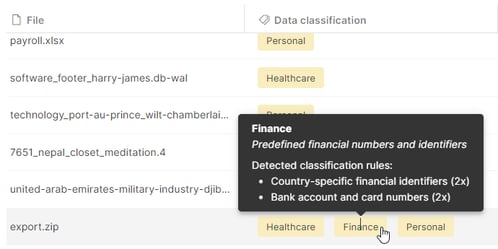
The admin sees a file classified as Finance, Healthcare, and Personal and wants to find out why it is considered sensitive and why it was classified with three classifications. They can hover individual classifications to see more info:
They can also click the file to open its detail and go to the Classification tab. Here they will see:
- Specific data classifications matched in the file.
- Deleted classifications: Classifications that are no longer used in Safetica but were used when the file was classified are labeled gray with the word (deleted).
- Which classification rules were hit (i.e. why the file was matched with the Finance classification).
- What types of classification elements were found (e.g. which keywords, predefined algorithms, etc.). For regexes and predefined algorithms, we only show the templates, not specific instances (e.g. specific credit card numbers are not shown).
- The number of found unique occurrences of each piece of sensitive information.
For archives (such as .zip or .rar), Safetica shows the list of archived files that have a classification; files without classification are not shown.
✨Safetica Platform only:
Example: How risk assessment empowers your investigations
There are very many records captured by Safetica in the Data section. To easily investigate what could be data leaks, the admin decides to filter out all high and medium-risk file operations.
There is one high-risk file operation. To investigate it, the admin clicks it to open its detail and then looks through the info in the Risk assessment tab. They immediately find out that the file is considered high-risk because it was transferred by a risky application at an unusual time and it contained sensitive health-related info. The same info can also be found by hovering over the risk indicator in the Risk assessment column.


