Understand data-related activities
Get insight into data-related operations and identify potential issues. Use powerful record filtering and visualizations for in-depth analysis of data-related activities.
Product plans: Standard | Premium | Enterprise | On-Prem (see: Limits by plan)
Product differences:
- Delete operations are not recorded in Safetica Platform.
- Risk assessment is not available in Safetica On-Prem.
In this article, you will learn about:
Introduction
All file operations that were captured on devices protected by Safetica are visible in the Data section. Explore the Data section to analyze data-related activities, identify potential issues, and utilize powerful record filtering for in-depth insights. The Data section is divided into two main parts: charts and tiles on top and records below.
Data analysis in action
Want to see the Data section in action? Watch the video below to learn how to analyze data in Safetica:
Charts and tiles
The chart and tiles allow you to see and filter:
- Users by data-related incidents: Identify users with the highest number of caused incidents. Some of these incidents may have been blocked. Click Show more to display all users and deep-dive into what exactly they were doing.
- Operations by data classification: Find out what data types were moved around, at what times, and in what amounts. Delve into a specific data classification (e.g. personal data) and see what specific data were moved on specific days.
- Audited operations: Total number of events detected by Safetica.
- Blocked operations: Number of events blocked by Safetica.
- M365 external sharing: Number of files shared outside the company via Microsoft 365.
Records
When investigating an incident or reviewing recorded file operations, you can apply filters to narrow down the number of displayed records.
Here are more details about some of the columns in the records table:
- ✨Safetica Platform only: Risk assessment: Indicator of how likely it is that the file operation caused a data loss. Learn more about risk in Safetica here.
- User: Name of the person who performed the file operation.
- Application: Name of the application in which the file operation was performed.
- Data classification: Names of data classifications that matched the file (a file may be classified with one or more data classifications).
- Policy: Name of Safetica policy applied to the file operation (only one policy can be applied to each operation).
- Action: Action performed by the policy - a file operation can be allowed, logged, or blocked, the user may be notified, or they can override blocking by providing reasoning.
- Source/Destination type: Specifies the location type, e.g. local drive, external device, web address, cloud disk, etc. Webmail means a web page from the Webmails category, and File sharing means a web page from the File sharing category.
Incident details
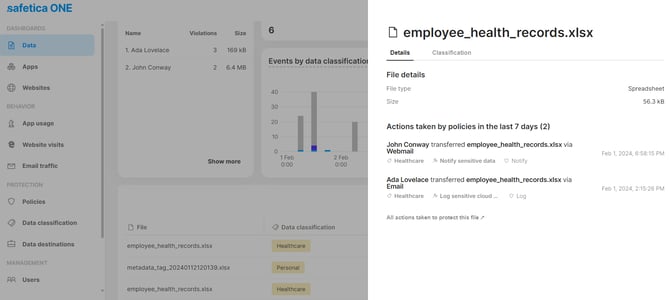
- Clicking any record in the Data section displays more details about the file.
- The Details tab lists all the operations related to the file in the last 7 days.
- The Classification tab lists all data classifications matched in the file.
Example: Investigate upload of large files
An administrator wants to see all files larger than 10 MB that were uploaded to wetransfer.com. They can set up the following filters:
Example: Investigate potential data leak
An administrator is investigating a potential data leak in the Graphics department. They want to see all sensitive files that were transferred to external USBs:
✍️Creating a virtual report: The URL of every Safetica console section reflects all the filters, groups, sorting, etc. that you set. When you bookmark such a URL, you can keep coming back to the information you want to view even after you close Safetica console.
FAQ
Q: Does Safetica record delete operations?
A: Delete operations are recorded only in Safetica On-Prem. They are not recorded in Safetica Platform.
