In this article, you will learn about:
Introduction
In the Apps section of Safetica, you can gain valuable insights into the use of applications within your company. This article provides a brief overview of how charts, tiles, and the table can be used to filter and display information about uncategorized apps, categorized apps, blocked apps, and app categories.
App usage analysis in action
Want to see the Apps section in action? Watch the video below to learn how to analyze app usage in Safetica:
Apps section
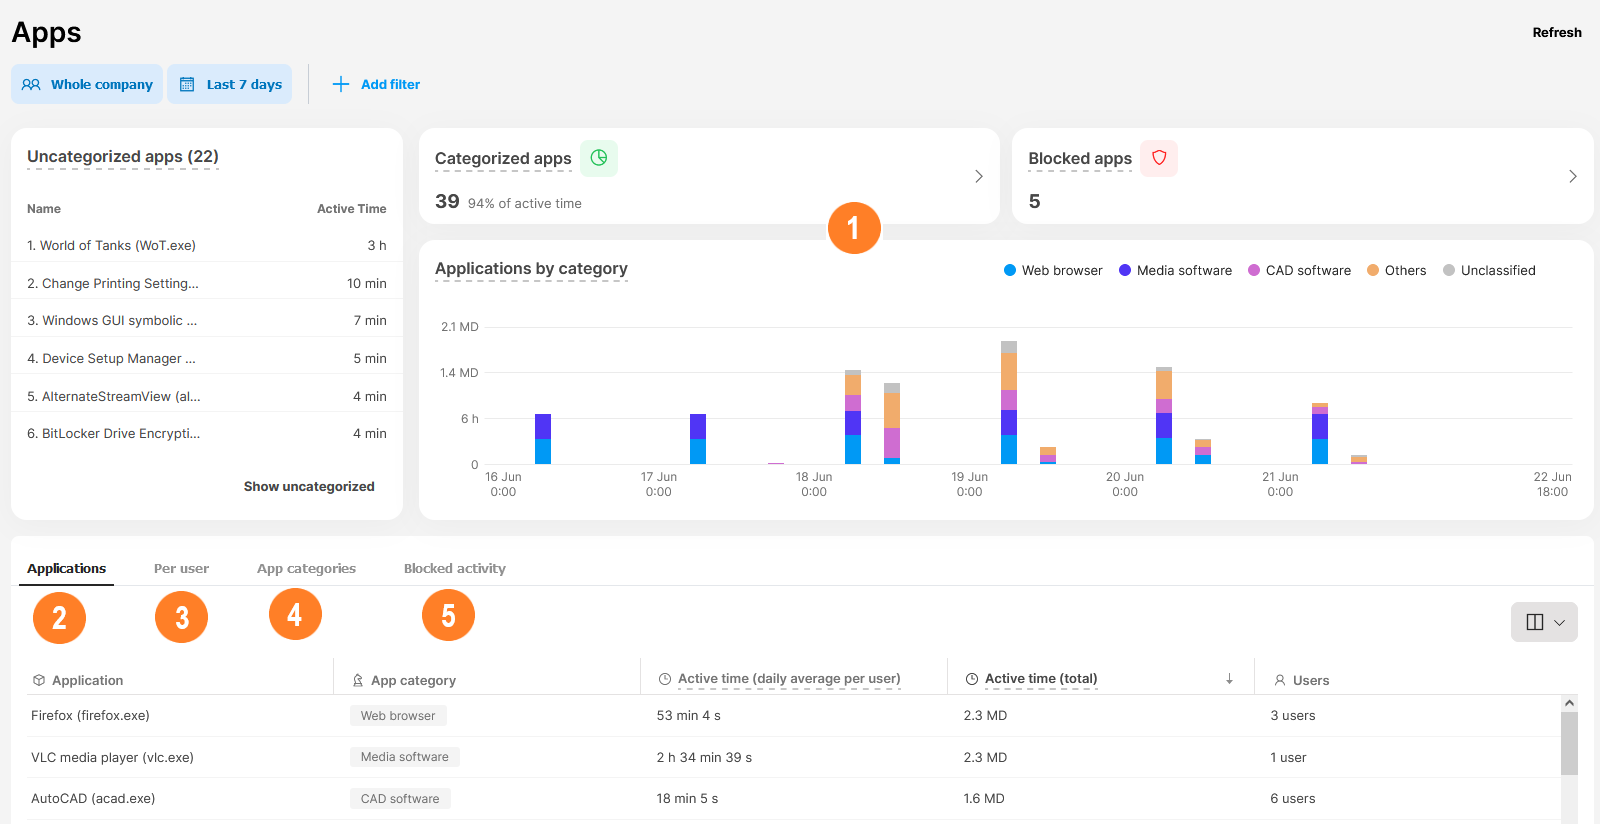
1. Charts and tiles
The charts and tiles in the Apps section serve as powerful tools to filter and display important information. Here's what you can do with them:
- Uncategorized apps: Uncategorized apps in this chart are ordered by the total active time users spent in them. Click Show more to see all uncategorized apps in the table.
✍️What is active time?
Safetica records time spent in an application only when a user is actively working in it. This includes clicking, typing, or moving their mouse in the active window. If an application is running in the background, Safetica doesn't record this. When the user stops performing any activity in the application, Safetica stops counting the active time after 5 minutes of inactivity. This is a default value that can be altered in Safetica Maintenance Console in Maintenance > Endpoint settings > Other settings by defining the Interval for the user's inactivity determination.
✍️What is MD?
MD is a time unit that means man-day. One man-day is equivalent to 8 hours.
- Categorized apps: Click the Categorized apps tile to display all categorized apps in the table below.
- Blocked apps: The number of unique blocked apps. Click the tile to see the details of all attempts to use these blocked apps.
- Applications by category: Display apps from the three most frequent app categories. Click the individual categories in the chart to filter them in the table and other tiles.
2. Applications tab
The Applications tab shows an overview of general app usage in the company. Click a specific app to view its details, including the most active users, the category, and more. Learn more about leveraging details in Safetica here.
3. Per user tab
The Per user tab is more focused on users. You can check specific users and see what apps they use. Values are aggregated, providing a general overview of each user's activities. You don’t see detailed records of when exactly they used the apps, or how much time they spent in them during working hours.
✍️To deep dive into user activities, go to the Behavior > App usage section, where you will see very detailed info about how apps are used by individual users, when, for how long, etc.
4. App categories tab
In the App categories tab, you can easily identify the applications categories used in your company. Determine if many users use categories such as Games or Miners, etc., and make informed decisions about blocking certain categories.
5. Blocked activity tab
If you decided to block an app via your policies, all the attempts to run such apps will be recorded in the Blocked activity tab. This way, you will identify policy violations and gain insights into who was running blocked applications. To learn more about policies in Safetica, click here.
❗The Blocked activity tab is only available to customers with Safetica Pro or Safetica Premium licenses.