Introduction
All protected devices are listed in the Devices section. It is the central place to review the current state of each device, manage devices, and troubleshoot them. You can also download the Safetica Client installer for Windows or macOS.
Each device's state is organized into separate, filterable columns, so you can tell at a glance whether a device is protected, where an installation or update stands, and whether troubleshooting is in progress.
Devices section in action
Want to see how to manage devices in Safetica? Watch the video below:
Permissions
Managing devices is available to Safetica admins with the Devices management permissions.
Admins with only the Devices view permission gain read-only access to the Devices section.
The Devices section
The Devices section lists your devices in a table and gives you the tools to filter, group, and manage them.
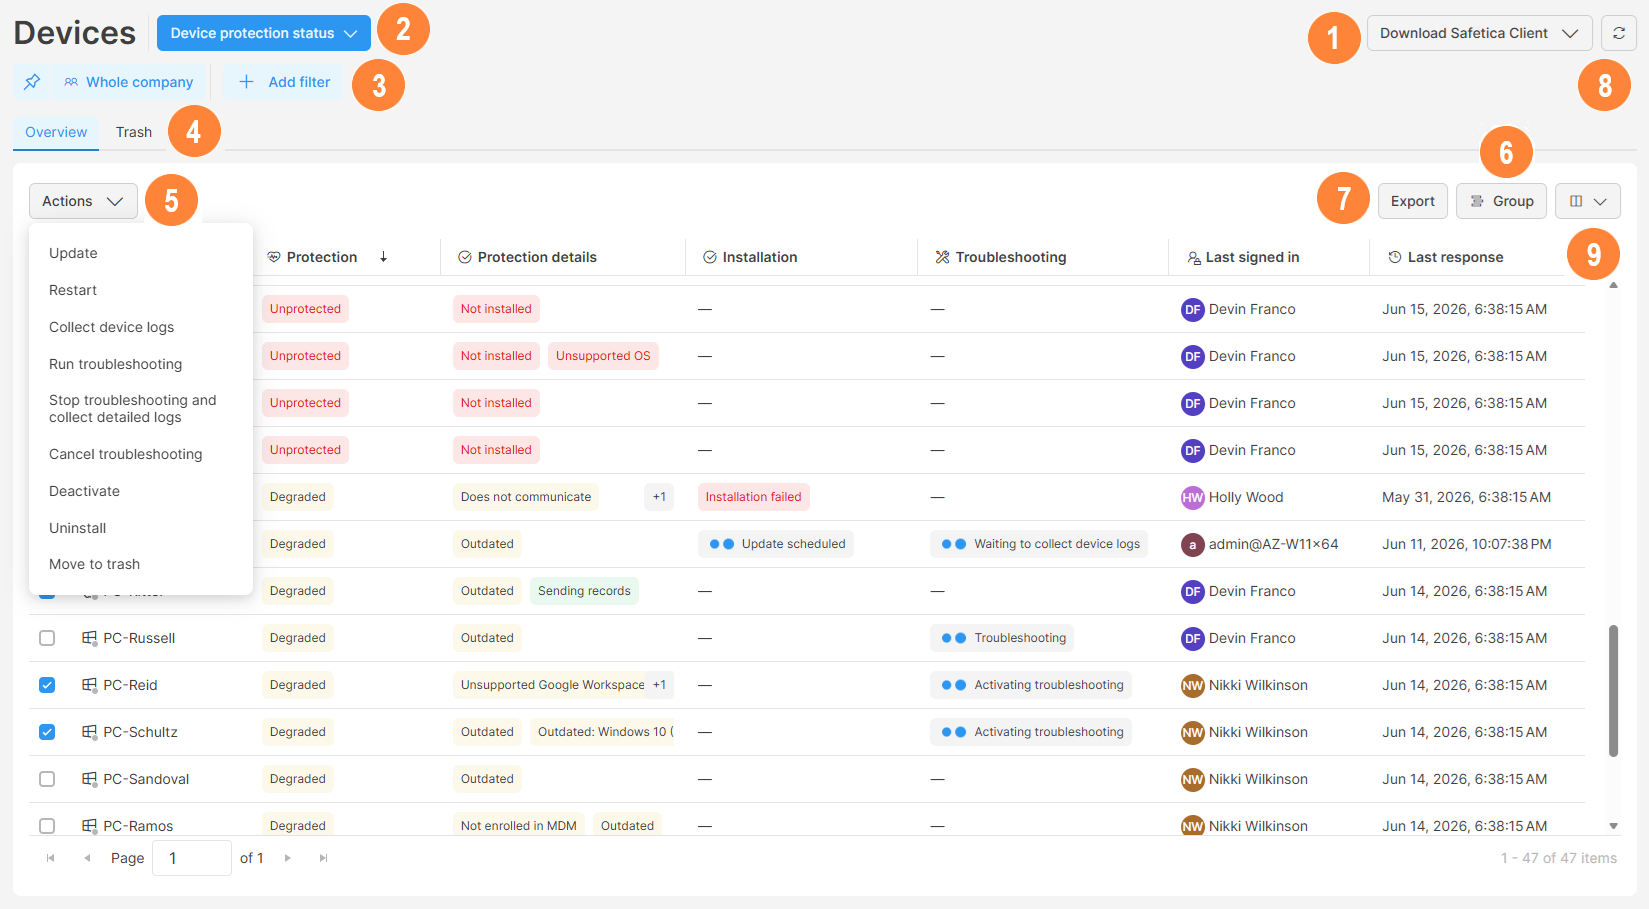
1. Download Safetica Client:
You can download the Safetica Client installer for Windows or macOS. Learn more about Safetica Client installation here.
2. Layouts:
A layout controls what info is presented in the Devices section. You can switch between predefined layouts or create your own. The predefined layouts are:
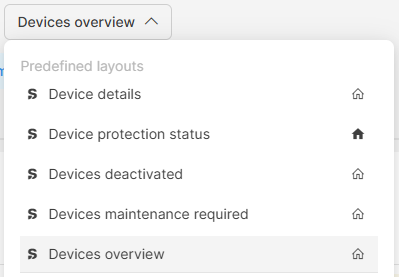
- Device protection status: The default layout, focused on the device's protection state.
- Device details: A wider layout that displays all columns.
- Devices deactivated: Displays devices where Safetica Client has been deactivated.
- Devices maintenance required: Displays sevices in states that need attention.
- Devices overview: A layout that displays selected columns.
- Devices grouped by protection: Displays devices grouped by their Protection status.
- Devices grouped by protection details: Displays sevices grouped by their Protection details status.
Learn more about how to use layouts here.
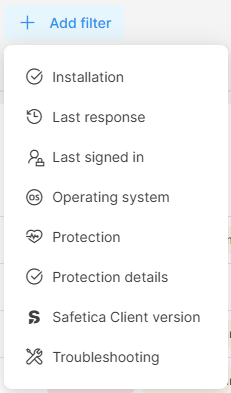
3. Filter devices
You can filter devices via the users, teams, and devices filter. Learn more here.
You can also click Add filter to filter devices based on their installation status, last response time, last signed in user, operating system, protection status, protection details, Safetica Client version, or troubleshooting status.
 Selected filters apply to both the Overview and the Trash tabs.
4. Tabs
The Devices section is divided into two tabs:
- Overview: Lists all devices with Safetica Client installed.
- Trash: Lists devices that were moved from Overview to Trash. Use the Restore action to move selected devices back to Overview. Learn more here.
✍️Devices in Trash are no longer displayed in the user tree, and their records are not visible in any of the Dashboards sections.
5. Manage devices with actions
Select the devices you want to manage with the checkboxes. When you select the bulk checkbox, all devices on the page are selected. If there is more than one page (more than 50 devices), you can also see additional clickable text to select all devices from all pages. 
After you select one or more devices, the Actions drop-down appears. Only actions applicable to at least one of the selected devices are shown. The available actions are:
- Update: Update Safetica Client on selected devices to the newest version. Only compatible devices are updated. Learn more here.
- Restart: Restart the selected devices. Only devices in the Waiting for restart state are restarted. Learn more here.
- Collect device logs: Collect basic device logs that are already available on the selected devices. You don't need to reproduce the issue. Learn more here.
- Cancel log collection: Cancel log collection on the selected devices. No logs are collected. Learn more here.
- Run troubleshooting: Generate and collect detailed logs with more info from the selected devices. You must reproduce the issue on the problematic devices. Learn more here.
- Stop troubleshooting and collect detailed logs: After reproducing the issue, stop troubleshooting the selected devices and start collecting detailed logs. Learn more here.
- Cancel troubleshooting: If you realize you do not need the detailed logs, you can cancel troubleshooting on the selected devices. No logs are collected. Learn more here.
- Deactivate: Deactivate Safetica Client on the selected devices. This stops all audit and protection. Only compatible devices are deactivated. Learn more here.
- Activate: Activate Safetica Client on the selected devices after it was deactivated. This re-enables audit and protection. Learn more here.
- Uninstall: Uninstall Safetica Client from the selected devices. To restore protection, you need to re-install it from scratch. Only compatible devices are uninstalled. Learn more here.
- Move to trash: Move the selected devices to the Trash. Learn more here.
-
Restore: Restore the selected devices and move them from Trash back to Overview. Learn more here.
6. Grouping
You can group records in the Devices table by the following columns:
- Protection
- Protection details
- Installation
- Troubleshooting
- Safetica Client version
How grouping works for multi-value columns
Some columns can hold more than one value per record (e.g., Protection details). When you group by such a column, Safetica creates one group for each unique combination of values.
A device belongs to one group only - the group that matches its full set of values.
So a device with the protection detail A, B, C appears in group A, B, C. It does not appear in group A, B, or C. Group A contains only devices whose protection detail is exactly A.
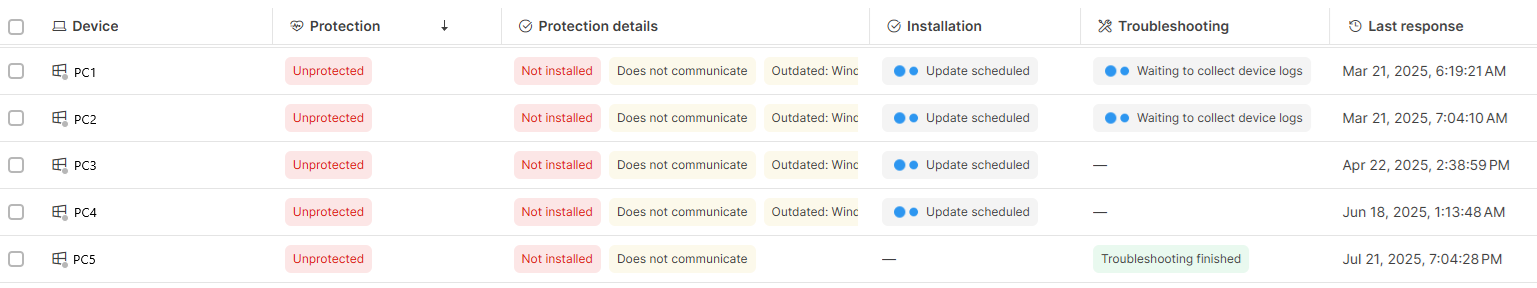
Example:
| Device | Protection detail |
| PC1 | Deactivated, Does not communicate, Outdated |
| PC2 | Does not communicate, Outdated |
| PC3 | Deactivated, Does not communicate, Outdated |
| PC4 | Deactivated |
This creates three groups:
| Group | Devices |
| Deactivated, Does not communicate, Outdated | PC1,PC3 |
| Does not communicate, Outdated | PC2 |
| Deactivated | PC4 |
✍️ To find every device that has a specific value (regardless of the other values), filter by that value instead of grouping.
7. Export
You can export the Devices table into a .xlsx file. Learn more about exporting in Safetica here.
8. Refresh page
To update the data shown on the page, click Refresh.
9. Select columns
To change which columns to display, click the drop-down![]() above the table.
above the table.
Device status columns: The states related to the device and Safetica Client
A device's state is shown across four separate columns, each with its own filter. You can also group and sort by each of them:
- Protection: An aggregated health status that tells you at a glance whether the device is protected.
- Protection details: The specific protection-related states behind the Protection status.
- Installation: The state of Safetica Client installation, updates, and restarts.
- Troubleshooting: The state of troubleshooting and log collection.
How states are color-coded
In the Protection details, Installation, and Troubleshooting columns, individual states appear as color-coded labels based on how pressing they are:
- Red: Pressing issues, usually a device that is not working correctly.
- Orange: Less pressing issues, usually Safetica Client being out of date.
- Grey: An action in progress.
- Green: Correct states that need no attention.
Protection
The Protection column shows one of three aggregated statuses:
- Protected: Safetica Client is working correctly, and the device needs no attention.
- Degraded: The device is still protected, but there is an issue that needs attention (for example, Safetica Client is out of date).
- Unprotected: Safetica Client is not actively protecting the device (for example, it is deactivated, not installed, or not communicating).
When a device has several Protection details states at once, the Protection column is based on the most serious one. For example, if a device is both Outdated (orange) and Deactivated (red), the Protection column shows Unprotected (red).
![]()
Protection details
The Protection details column shows the specific state of the device and Safetica Client. Possible states include:
| Status | Explanation |
| Does not communicate |
The device has not communicated with the server for 14 days. This can mean either that the Safetica Client is not responding, or that the device has been powered off or inactive for an extended period. 🪟Windows: If the device is on, follow the steps here. 🍏macOS: If the device is on, follow the steps here. |
| Missing records | Safetica Client is not sending any records of data or user activities. 🪟Windows: Follow the steps here. 🍏macOS: Follow the steps here. |
| Certificate refused |
The device rejected Safetica server's certificate. Also, set up a trusted certificate for communication between the device and Safetica server. Learn more here. |
| Missing notification permission | 🍏macOS only: Notification permission is missing. Please install the Apple Configuration Profile. Follow the steps here. |
| Missing full disk access permission | 🍏macOS only: Full disk access permission is missing. Please install the Apple Configuration Profile. Follow the steps here. |
| Not installed | Safetica Client is not installed on the device. |
| Not enrolled in MDM | 🍏macOS only: The device is not enrolled in any MDM solution. Please enroll the device in an MDM solution to allow installation of the Apple Configuration Profile. Follow the steps here. |
| Outdated: Windows 10 (< 20H2) | The Windows 10 version on the device is outdated (older than 20H2) and no longer supported. |
| Unsupported Google Workspace Sync for Microsoft Outlook | Google Workspace Sync for Microsoft Outlook is not supported on the device. Our old Outlook add-in was in conflict with Google Workspace Sync for Microsoft Outlook. The error is not relevant to our new Outlook add-in. Learn more about the new Outlook add-in here. |
| Outdated | Safetica Client is outdated and should be updated. |
| Sending records | The device is currently sending records to Safetica server. |
| OK | Safetica Client is working correctly. This status doesn't reflect the technical state of the device, nor security issues. |
| Deactivated | Safetica Client was deactivated on the device. |
| Reactivating | Safetica Client is currently being reactivated. |
| Deactivating | Safetica Client is currently being deactivated. |
| Deactivated unexpectedly | Safetica Client isn’t running, even though it wasn’t deactivated. This might happen: - After migration from old Safetica (version 10) to new Safetica (version 11). If deactivation was set for a group of devices before migration, this state might appear in Safetica (version 11). - Due to missing .NET runtime libraries. - Due to a generally incorrect state of Safetica Client on the device. |
| Unsupported OS | The device is running an unsupported operating system. |
| Unknown | Unspecified issue with Safetica Client on the device. Please collect logs and contact Safetica Support. Follow the steps here. |

Installation
The Installation column shows the state of Safetica Client installation, updates, and restarts:
| Status | Explanation |
| Uninstalling | Safetica Client is currently being uninstalled from the device. |
| Uninstall scheduled | Uninstallation of Safetica Client from the device was scheduled, but hasn’t started yet. This usually happens when the device is offline while uninstallation is set for it. |
| Uninstallation failed | Safetica Client could not be uninstalled. Might happen, e.g., during Safetica Client update. |
| Restart scheduled | Restart of the device was scheduled, but hasn’t happened yet. For example, if the device was in the Waiting for restart state, and you scheduled its restart, its state will change to Restart scheduled. |
| Waiting for restart | The device is waiting to be restarted. |
| Updating | Safetica Client is currently being updated. |
| Update scheduled | Update of Safetica Client was scheduled, but hasn’t started yet. This usually happens when the device is offline while the update is set for it. |
| Installing | Safetica Client is currently being installed. |
| Installation failed | Safetica Client could not be installed. Might happen, e.g., during Safetica Client update. |
| Partially installed |
Safetica Client is only partially installed on the device. |
Troubleshooting
The Troubleshooting column shows the state of troubleshooting and log collection:
| Status | Explanation |
| Activating troubleshooting | Troubleshooting is about to start on the device. |
| Troubleshooting | Troubleshooting is currently running on the device. |
| Troubleshooting finished | Troubleshooting was completed successfully. |
| Troubleshooting failed | Troubleshooting failed or didn't finish. |
| Waiting to collect device logs | The device is waiting to start log collection. |
| Collecting device logs | Logs are being collected from the device. |
Other columns
Besides the status columns, you can display the following columns:
- Device: The name of the device and the icon of its operating system. A colored dot shows whether the device is online, based on its Last response:
-
- Green dot: The device is online. It might have been offline for 1-10 minutes.
- Yellow dot: The device has been offline for 10 minutes – 3 hours.
- Grey dot: The device has been offline for more than 3 hours.
✍️Terminals and servers are not differentiated in any way.
- Last response: The date and time when the device was last online. This column always shows the current time for online devices and updates each time you refresh the console.
- Last signed in: Which user last used each device.
- Operating system: The operating system the device is using.
- Records sent: The date and time when the last records were sent from the device to Safetica server.
- Safetica Client version: The version of Safetica Client installed on the device.
- Settings updated: The date and time when the device last received updated settings from Safetica server. This column only updates when a setting actually changes (for example, a change in data classification). A device can be online while this column shows an older date if no settings have changed since then.
- Teams: The teams to which the device belongs.
- Unsent records: Whether there are any records waiting to be sent to Safetica server (i.e., the device may be ok, but I must just wait for records to arrive).
Device detail
To see detailed info about a specific device, go to the Devices section and click the device in the table. In the device detail, you can:
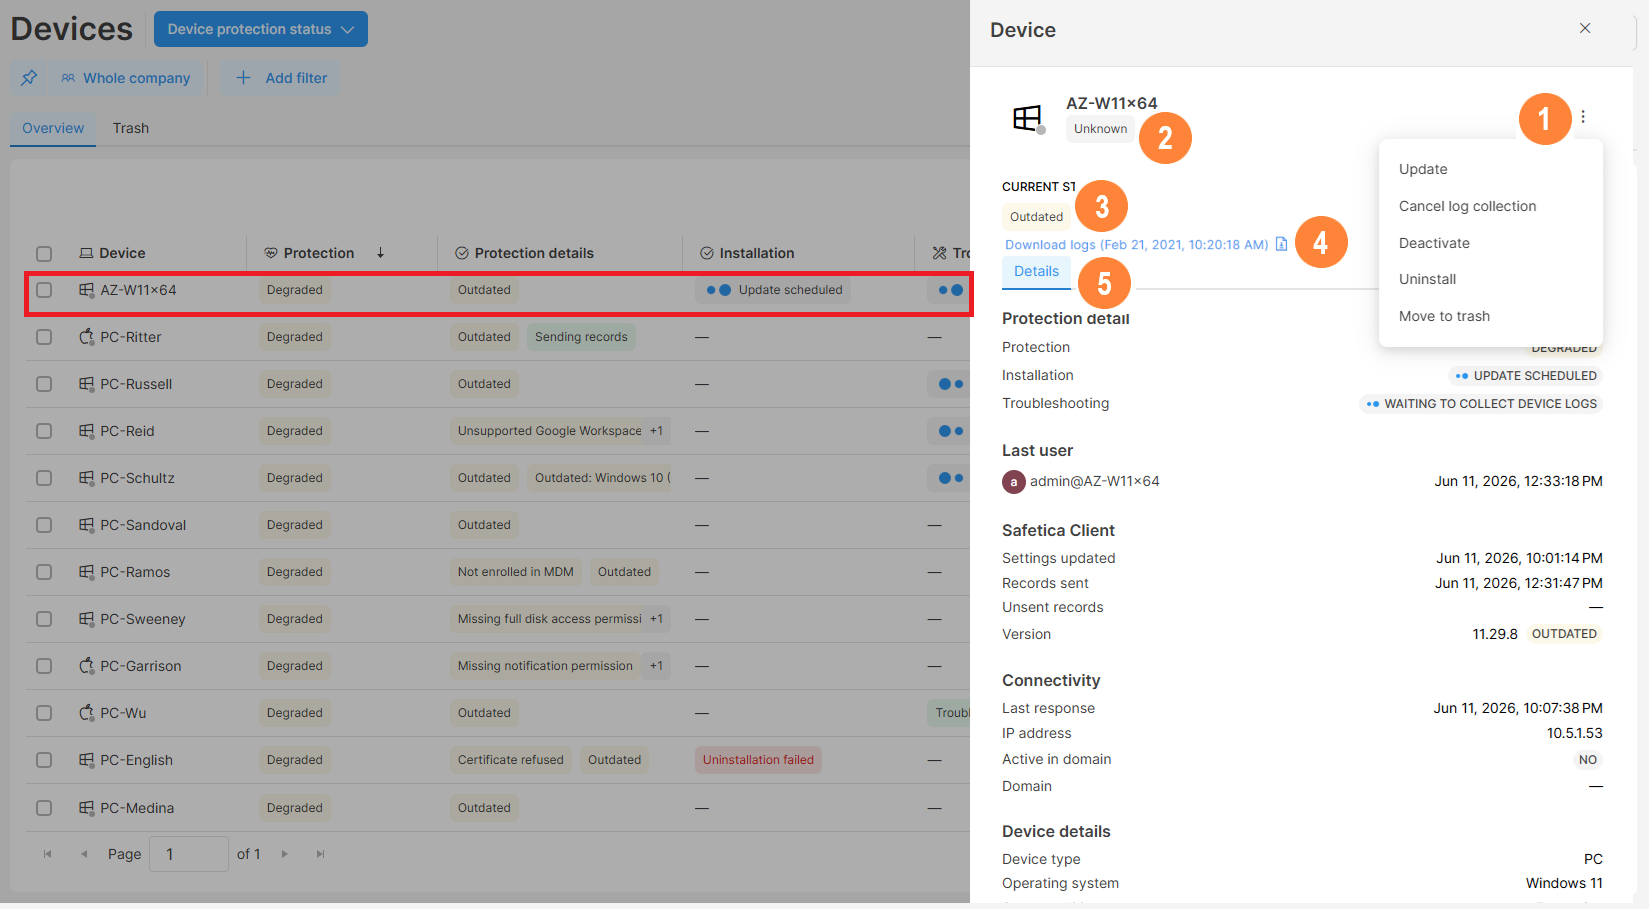
1. Click Actions to display the management actions available for the device. Only actions applicable to the device are shown.
2. See the teams to which the device belongs.
3. See the Protection details sorted by priority.
4. Download collected logs (if they are available).
5. In the Details tab, see info about the device's last user, when it last sent records, the state of Safetica Client, the internet connection, whether the device was redirected to another server, and system info.
FAQ
Q: Why does a device show as Degraded or Unprotected?
A: The Protection column is based on the most serious of the device's Protection details states. Open the device detail, or display the Protection details column to see exactly which states are causing it.
Q: In Safetica console, users appear active, but no data is collected. What should I do?
- The devices are communicating (look for the green dot on the device icon and check the Last response column).
- The relevant policies are enabled.
Q: I noticed an unknown or unrecognized device in my Safetica console. Why did this happen?
A: This may be caused by third-party security software (such as antivirus) on your network. These tools sometimes automatically run the Safetica installer in a temporary test environment (a "sandbox") to check if it's safe. When this happens, the sandbox briefly registers itself as a device in your console, even though no real installation took place. This is not a security risk. You can safely move the unknown device to trash.
If you're unsure about a device, check with your IT team whether anyone recently downloaded the installer, and review whether any security tools may have scanned it. You can also contact Safetica Support.
Q: What does the status Unsupported Google Workspace Sync for Microsoft Outlook mean?
A: The status indicates that the add-in Google Workspace Sync for Microsoft Outlook (GWSMO) was found on the device. It might cause conflicts with Safetica.
Read next:
Manage your devices from Safetica
How to install Safetica Client to your devices
How to restart, move to trash, or restore devices from Safetica